1 Introduction
1.1 About this report
The purpose of this report is to synthesize diverse information sources to assist with implementation of ecosystem-based fisheries management in the U.S. Caribbean region. A suite of indicators that span physical, biological, social and economic elements of the ecosystem are reported with the goal of helping the Caribbean Fishery Management Council (CFMC) and other resource managers measure progress toward fishery management objectives. The report relied on both previously identified proposed indicators as well as expert vetting to select a suite of indicators that best address the fishery management plan (FMP) objectives for the U.S. Caribbean. Information in this report is organized into two sections: 1) tracking performance toward predefined fishery management objectives, and 2) potential risks to meeting fishery management objectives.
1.2 Indicator selection
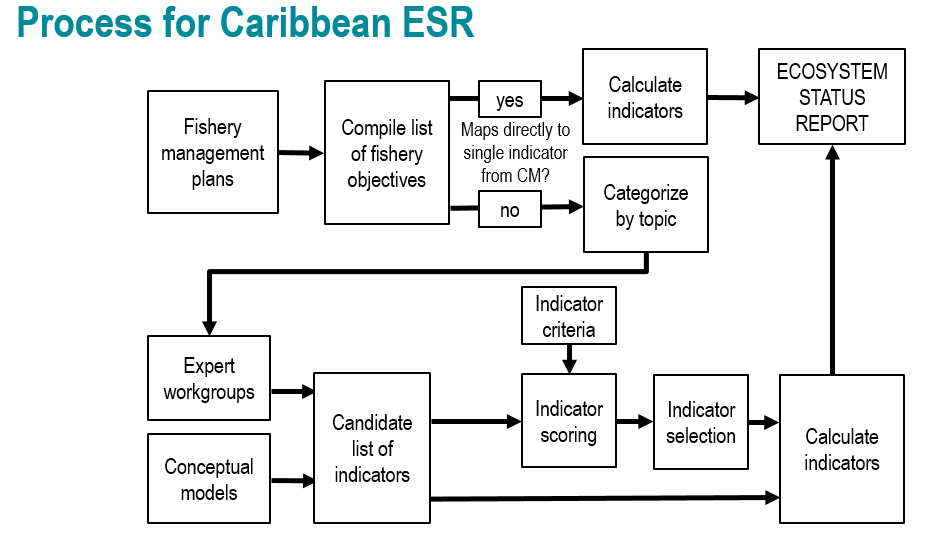
The CFMC’s Science and Statistical Committee, as well as the region’s Ecosystem-Based Fishery Management Technical Advisory Panel (EBFM TAP), recently completed a series of conceptual models linking key components of the ecosystem and human activities related to fishing (Seara et al. 2024). This report used these conceptual models as a starting list of proposed indicators and matched the indicators to answer FMP objectives when possible. For those objectives that did not have an immediate conceptual model-identified indicator, this report used a decision matrix process for expert vetting (Figure 1.1).
This decision matrix was composed of a list of proposed indicators compiled from the conceptual models as well as proposed indicators provided via expert input. These potential indicators were vetted and edited by expert small working groups, who then scored a decision matrix (Figure 1.1) of potential indicators against the following decision criteria: long term data availability, measurability, sensitivity to environmental changes, specificity, spatial and temporal scalability, relevance to specific FMP objectives, and responsiveness to management actions.
1.3 Notes on interpreting time series figures
Time series data are plotted in a standardized format for ease of interpretation (e.g., Figure 1.2). The x-axis represents the temporal dimension, which may be monthly, yearly, or irregular time steps, and the y-axis represents the indicator value in units specified in the axis label. Measures of uncertainty in the indicator values are also shown, when available. The dashed horizontal line represents the mean indicator value across the entire time series, and the solid horizontal lines denote the mean plus or minus one standard deviation. Red shaded areas and green shaded areas show years for which the indicator value is below or above one standard deviation from the mean, respectively. The blue vertical shaded box highlights the last five years of indicator values, over which additional metrics are calculated. Black circles to the right of each figure indicate whether the indicator values over the last five years are greater (plus sign), less than (minus sign), or within (solid circle) one standard deviation from the mean of the overall time series. Arrows to the right of each figure indicate whether the least squares linear fit through the last five years of data produces a positive or negative slope that is greater than one standard deviation (upward or downward arrows respectively), or less than one standard deviation (left-right arrow).


