2 Tracking performance toward fishery management objectives
In this section, we report indicators that are intended to capture progress towards meeting Fishery Management Plan objectives related to food production, socioeconomic health, equity, engagement and participation, bycatch reduction, governance and protection of ecosystems.
2.1 Food production
2.1.1 Abundance of economically important species
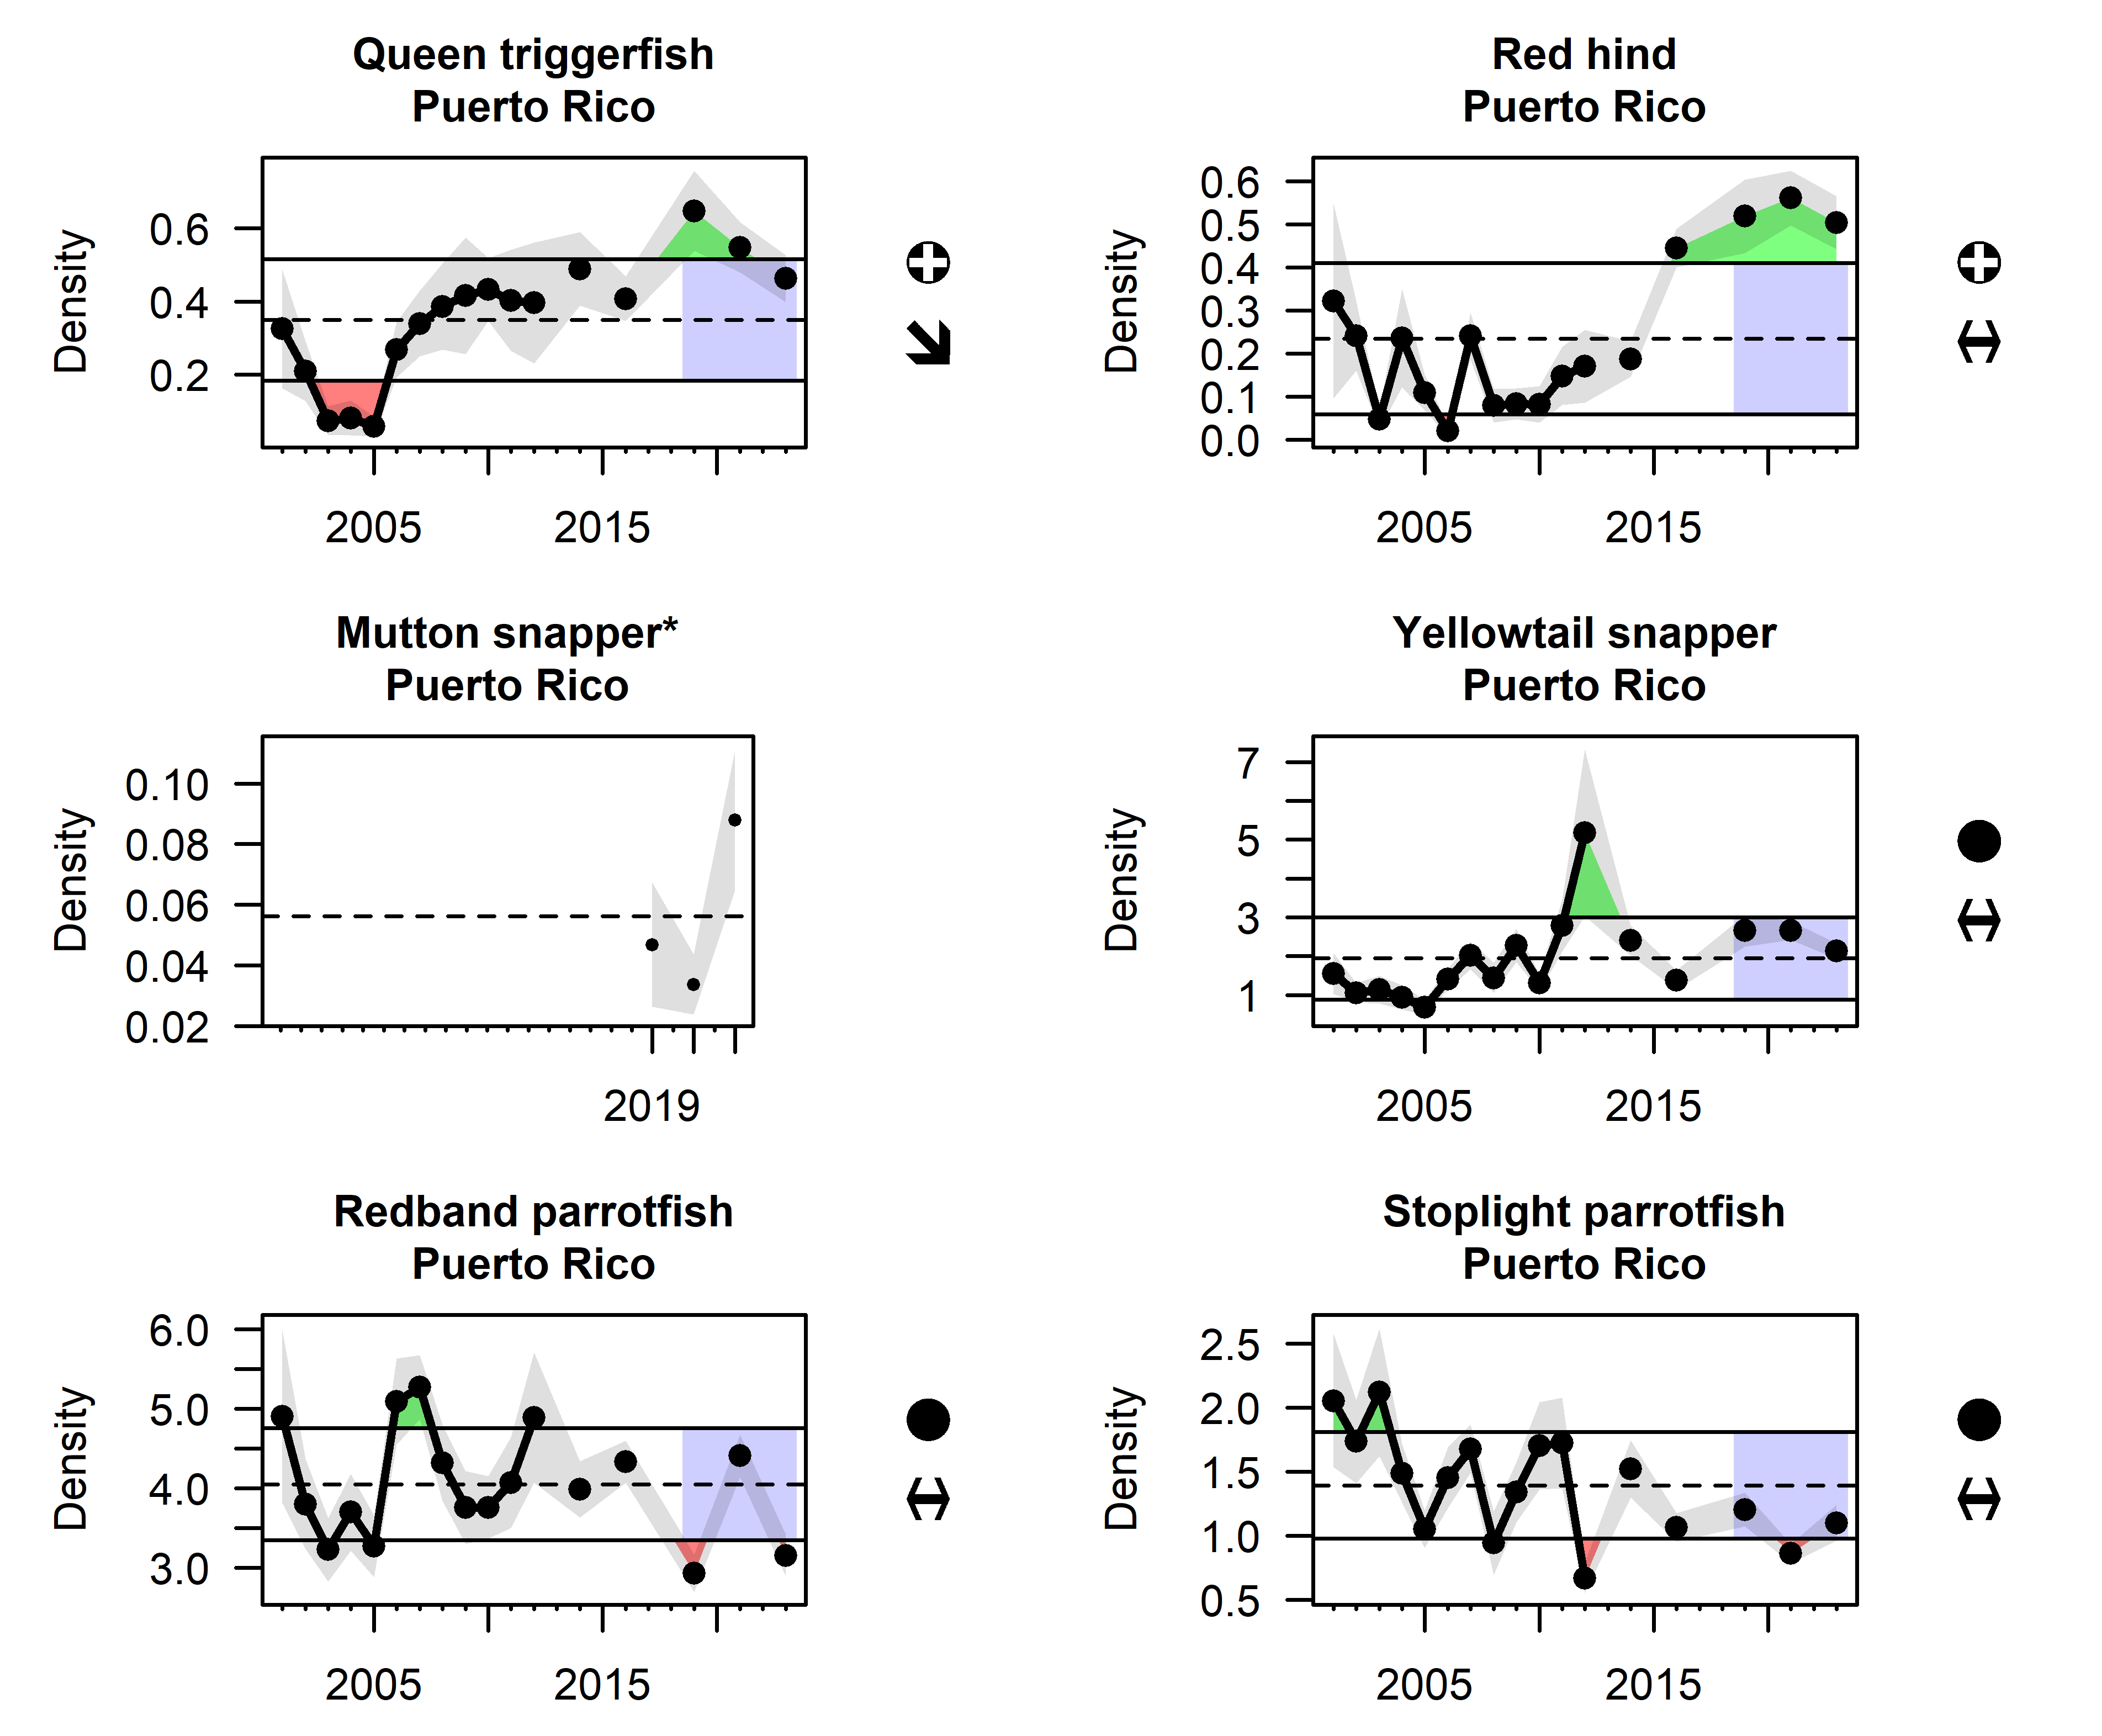
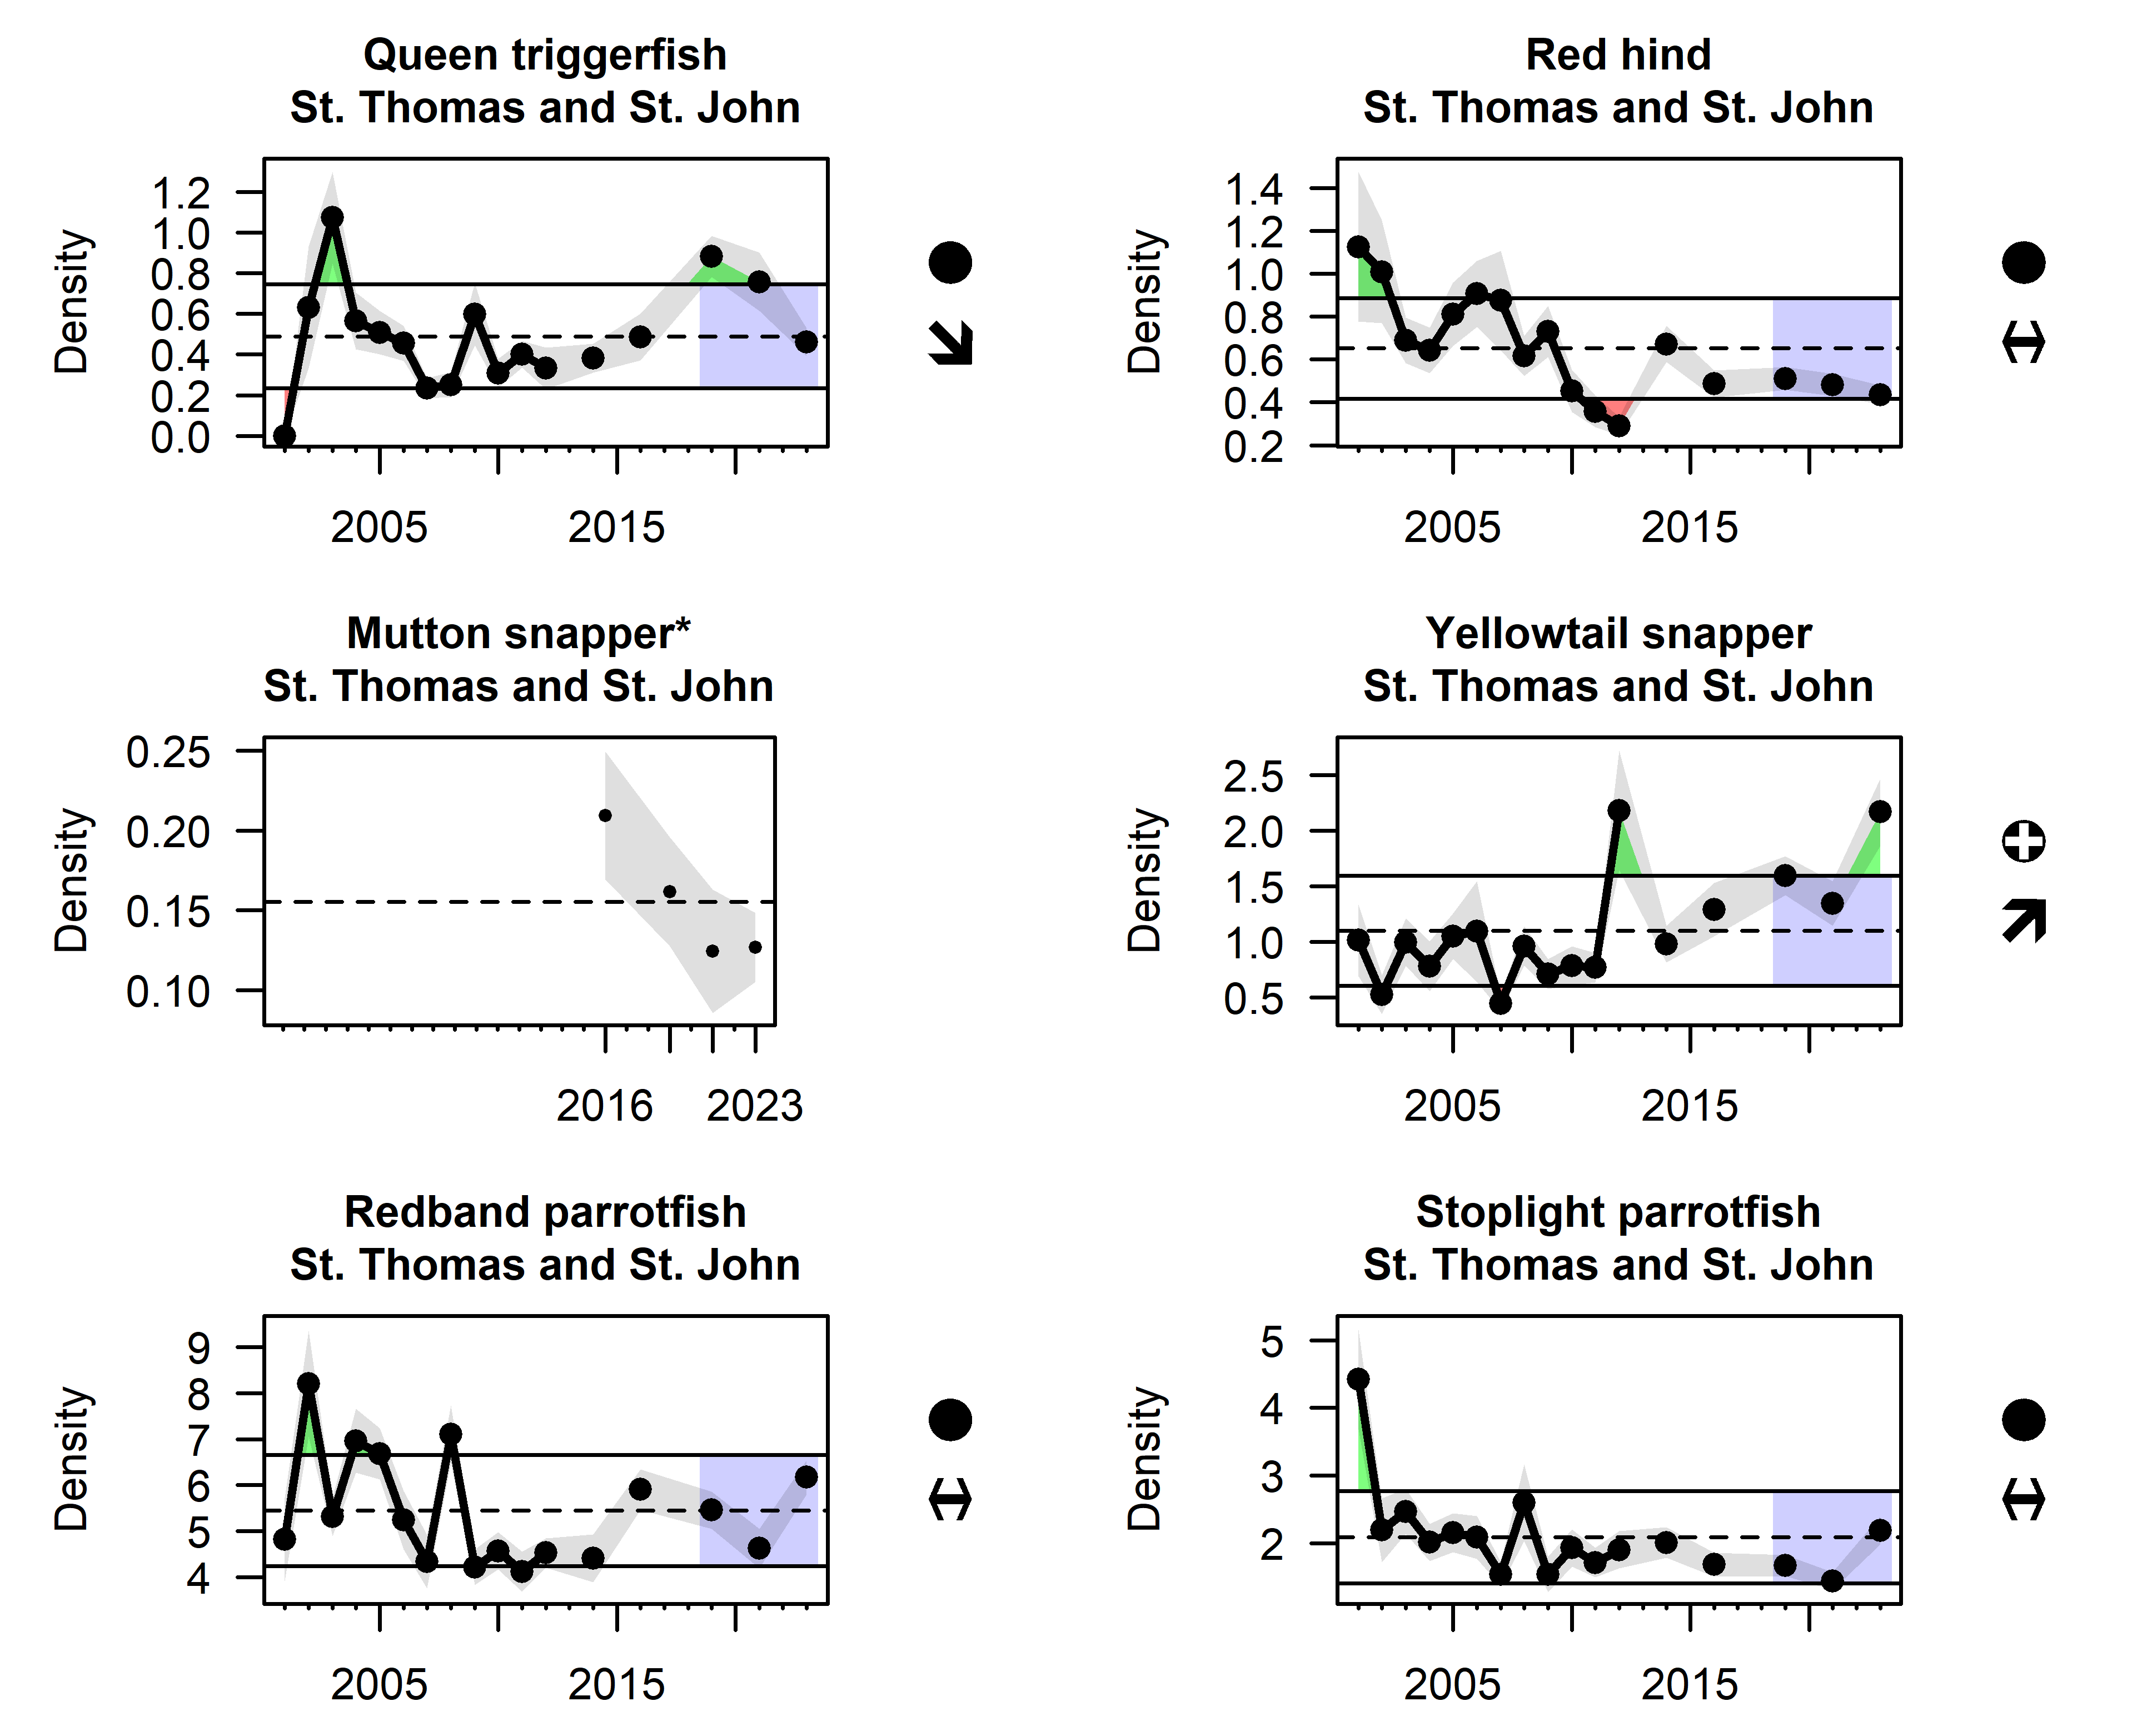
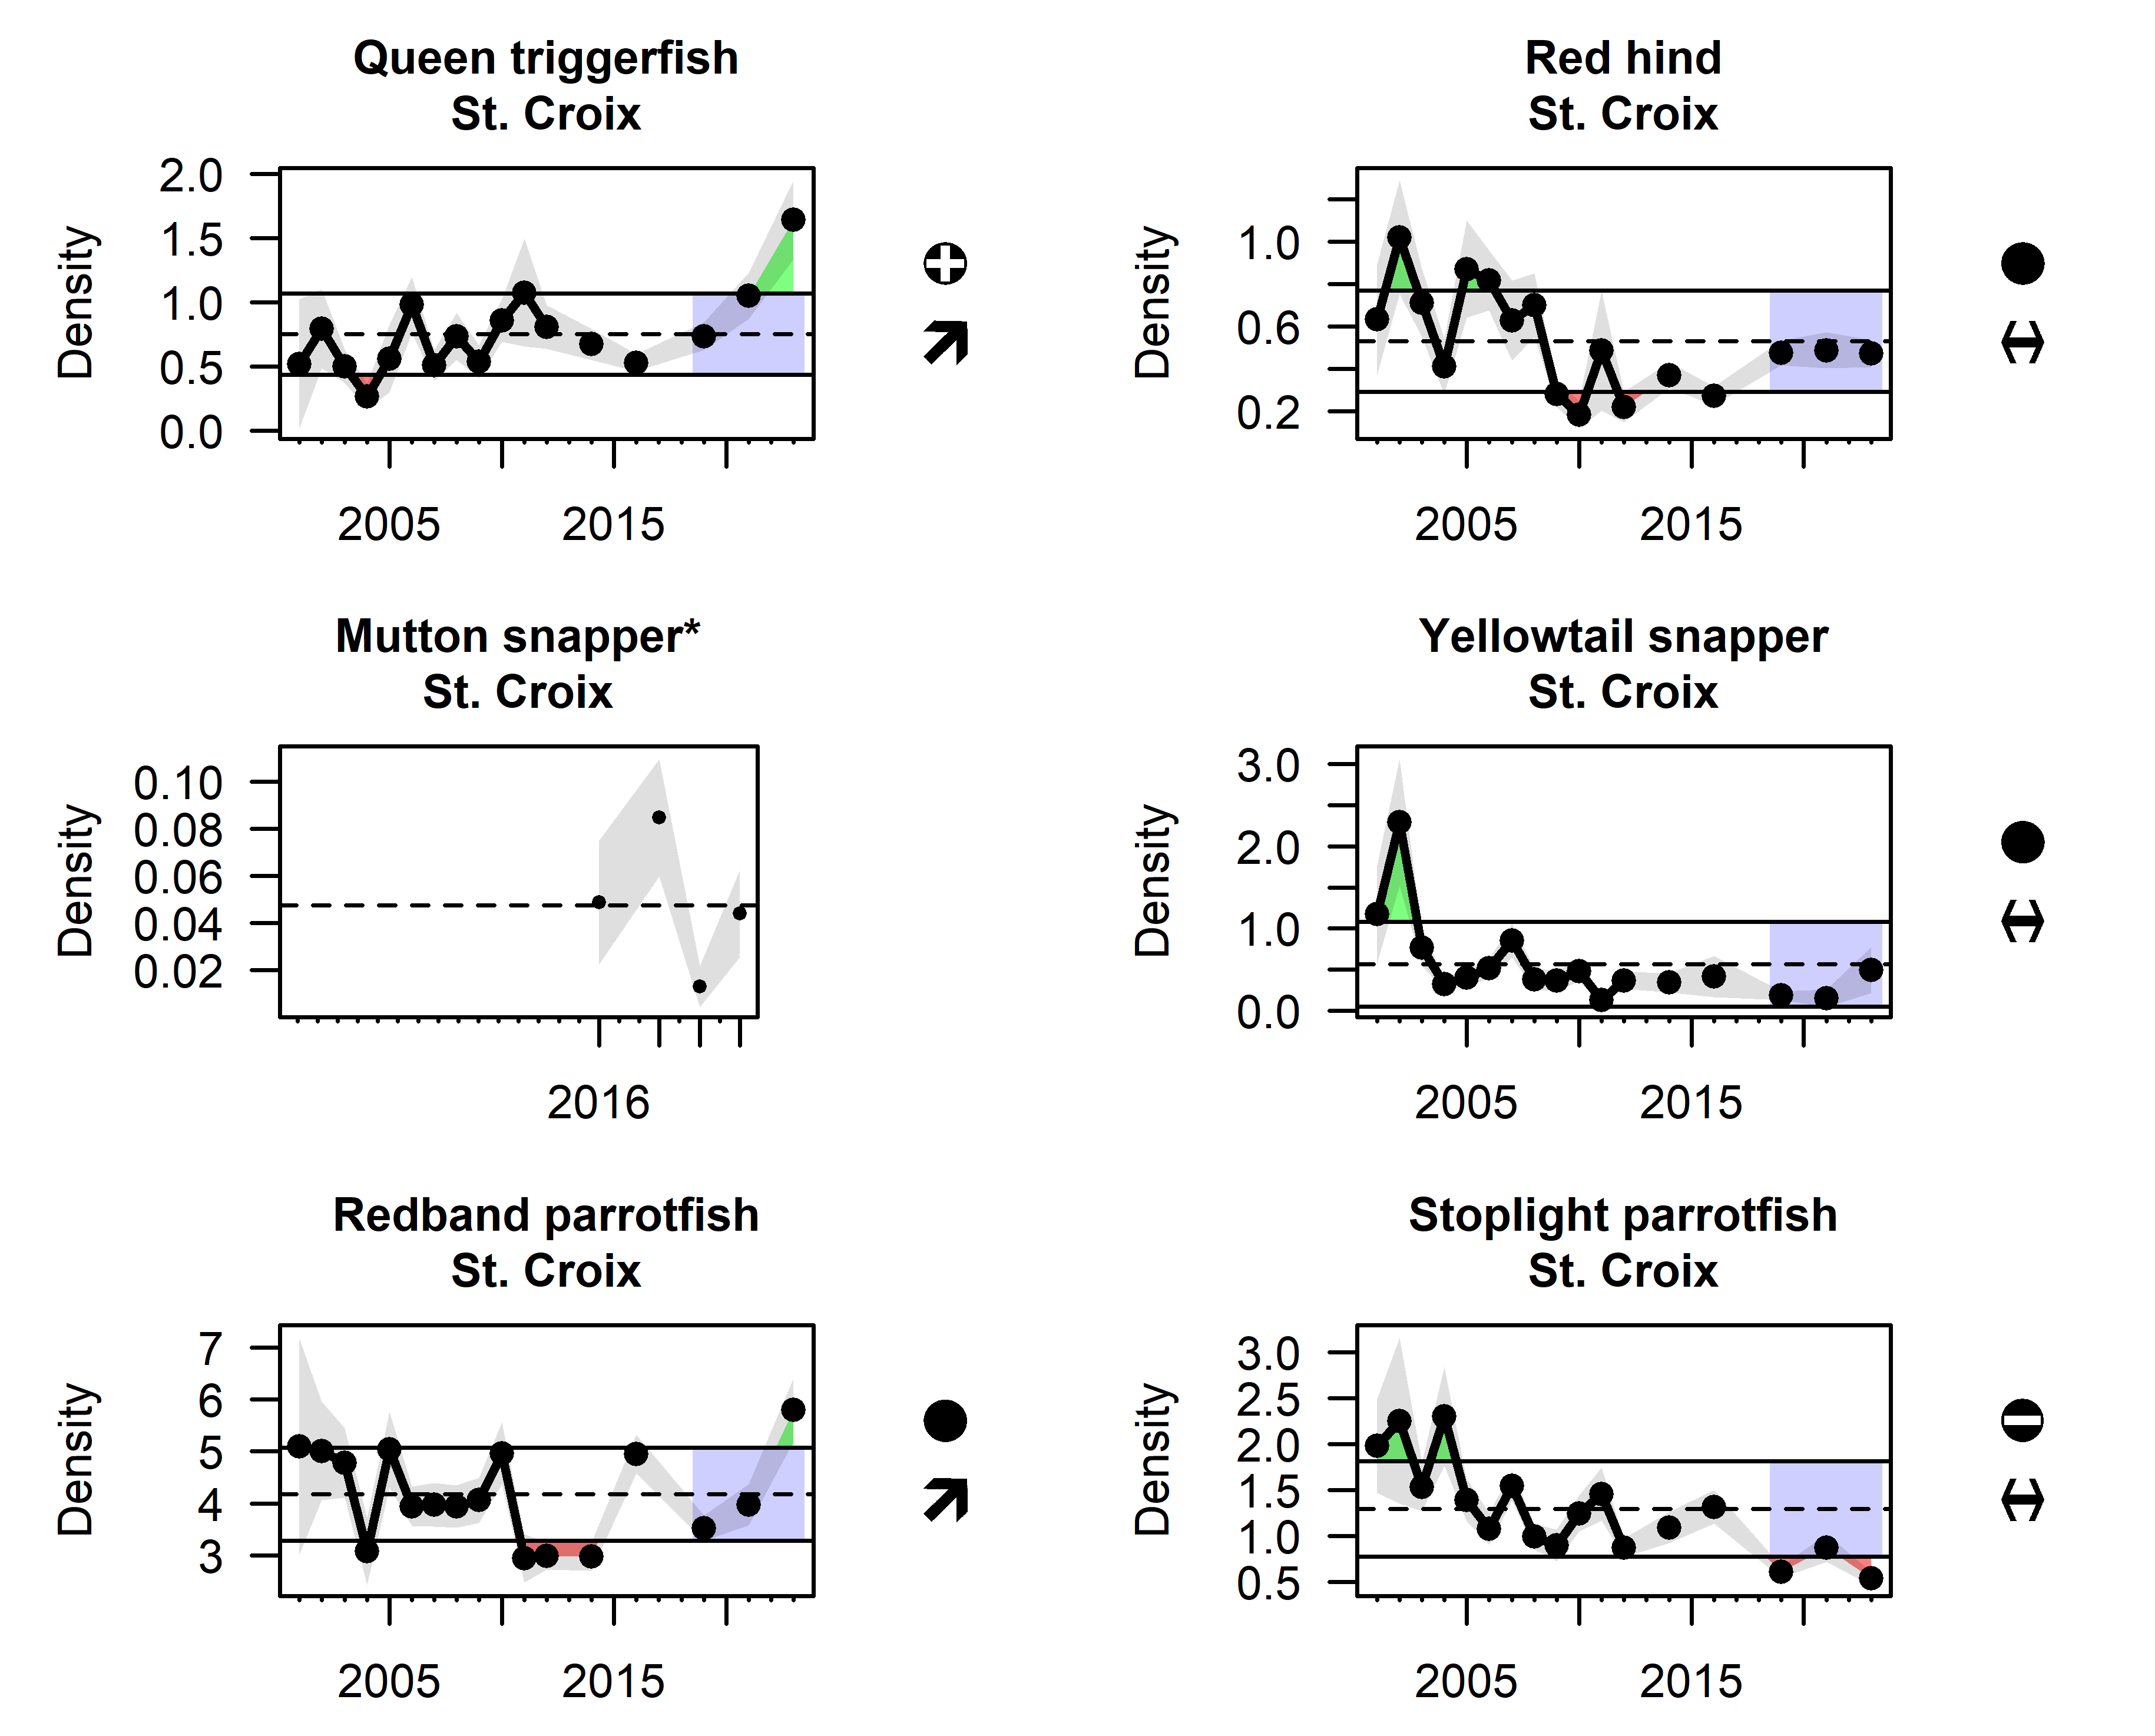
Fishery-independent surveys are conducted to understand the relative abundance trends of economically important fish species. NOAA, in collaboration with many academic and agency partners, has been conducting visual surveys of reef fish species in Florida since 1978 and surveys began in the U.S. Caribbean in 2001 (Smith et al. 2011). In 2013, these reef fish surveys were adopted by the NOAA Coral Reef Conservation Program’s National Coral Reef Monitoring Program (NCRMP) that is led by the Southeast Fisheries Science Center in the U.S. Atlantic and Caribbean (Towle et al. 2021). Six target fish species (lane snapper, yellowtail snapper, red hind, queen triggerfish, redband parrotfish, and stoplight parrotfish) were selected as key indicators for the condition of living resources in the U.S. Caribbean, due to their status as targeted species by recreational and commercial fishers. Trends in fish density for these species of interest are highly variable, but density has been at or above the time series average in recent years for most species. A notable exception is stoplight parrotfish, which have gradually declined over time in all regions and density is currently below average in St. Croix (Figure 2.1, Figure 2.2, Figure 2.3).
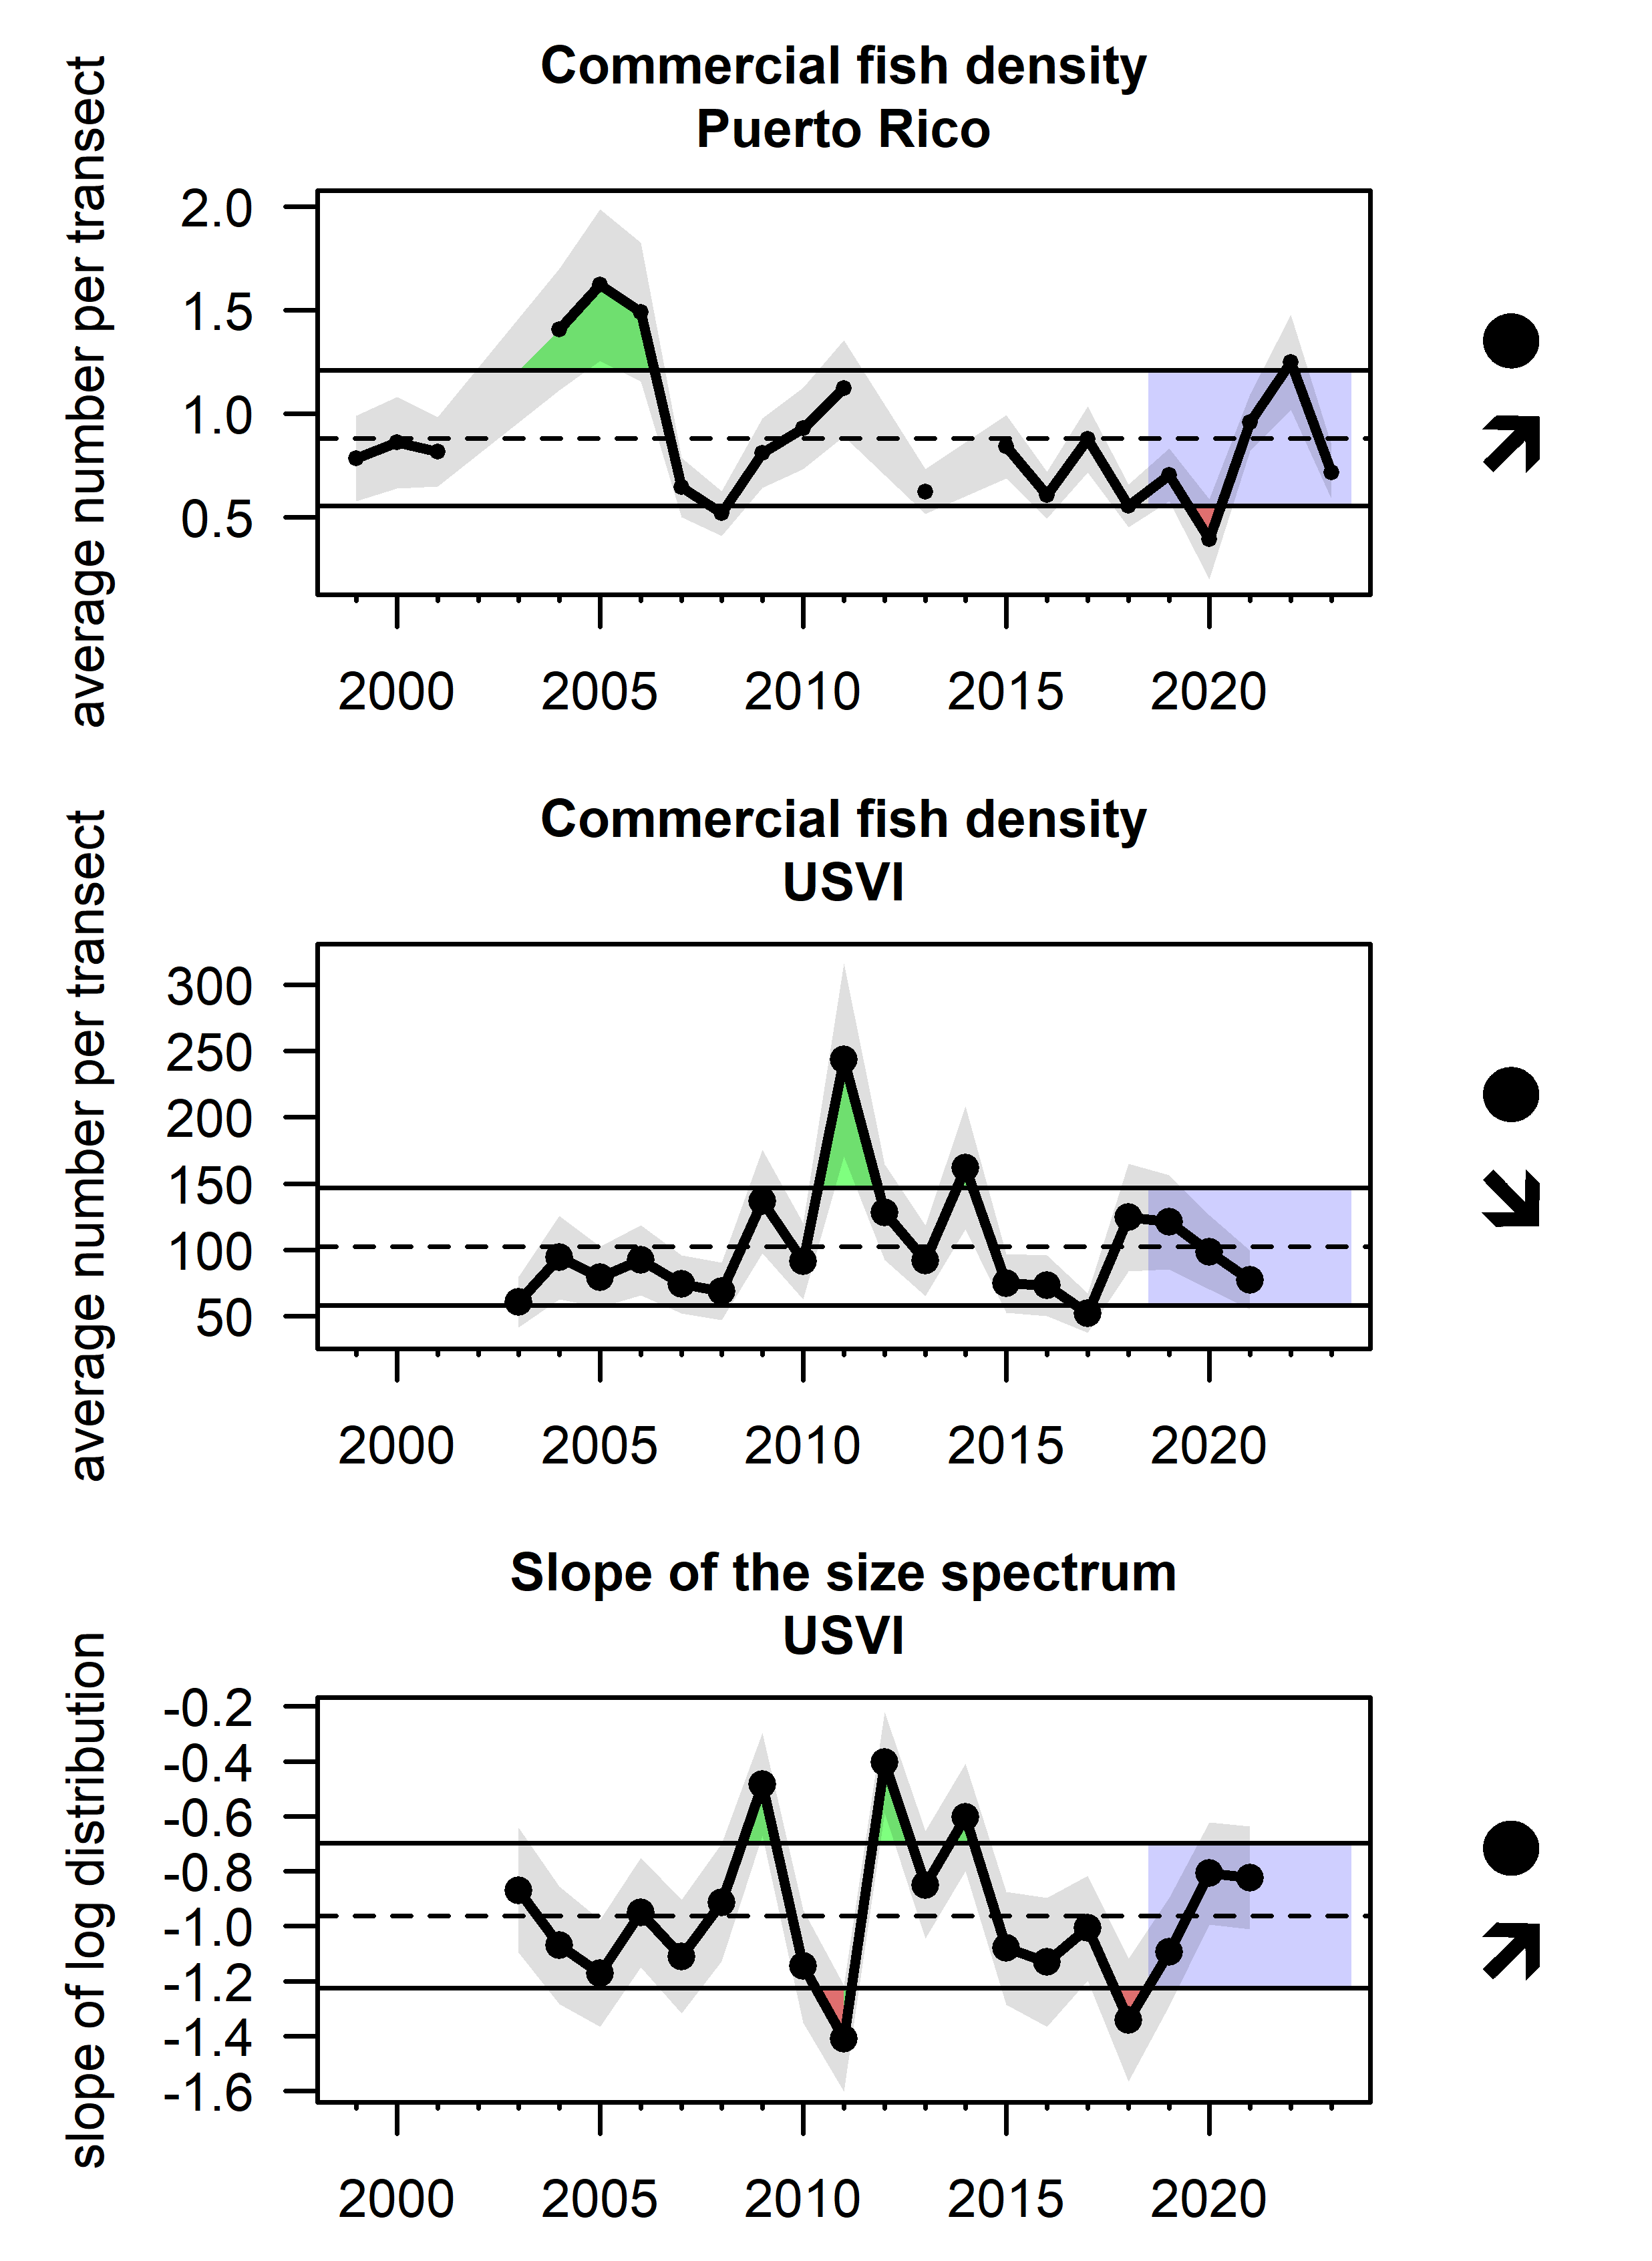
Fishery-independent surveys can be used to look at changes in the overall fish community and understand processes affecting multiple suites of species. The Puerto Rico Long-Term Coral Reef Monitoring Program (PRCRMP) has conducted annual surveys of fish and benthic organisms since 1999 (Puerto Rico Department of Natural and Environmental Resources 2019). Similarly, the USVI Territorial Coral Reef Monitoring Program (TCRMP) conducts annual to semi-annual surveys of coral health, fish community structure and coral health (https://www.vitcrmp.org/). The PRCRMP, TCRMP, and NCRMP programs are all supported by NOAA’s Coral Reef Conservation Program and are complementary, with PRCRMP and TCRMP sampling at fixed sites and NCRMP sampling at stratified random sites. Commercial fish density is calculated by taking the average number of commercially targeted fish per transect over time. The slope of the size spectrum is calculated by binning all observed commercial fish lengths into size categories and then fitting a linear regression through the log-transformed histogram; a more negative slope represents relatively fewer large fish and potentially increased fishing impacts. In Puerto Rico, average commercial fish density fluctuates but is stable over time; insufficient data were available with which to estimate the slope of the size spectra. In the USVI, commercial fish density has increased since the early 2010s, with notable peaks in 2018 and 2021. The slope of the size spectrum has been relatively stable over time but with sudden drops in 2011 and 2018. A single-year increase in density combined with a simultaneous decrease in the size spectrum conveys the sudden appearance of many small fish, suggestive of a large recruitment event across multiple species in 2018 (Figure 2.4).
2.1.2 Pelagic:demersal ratio of landings
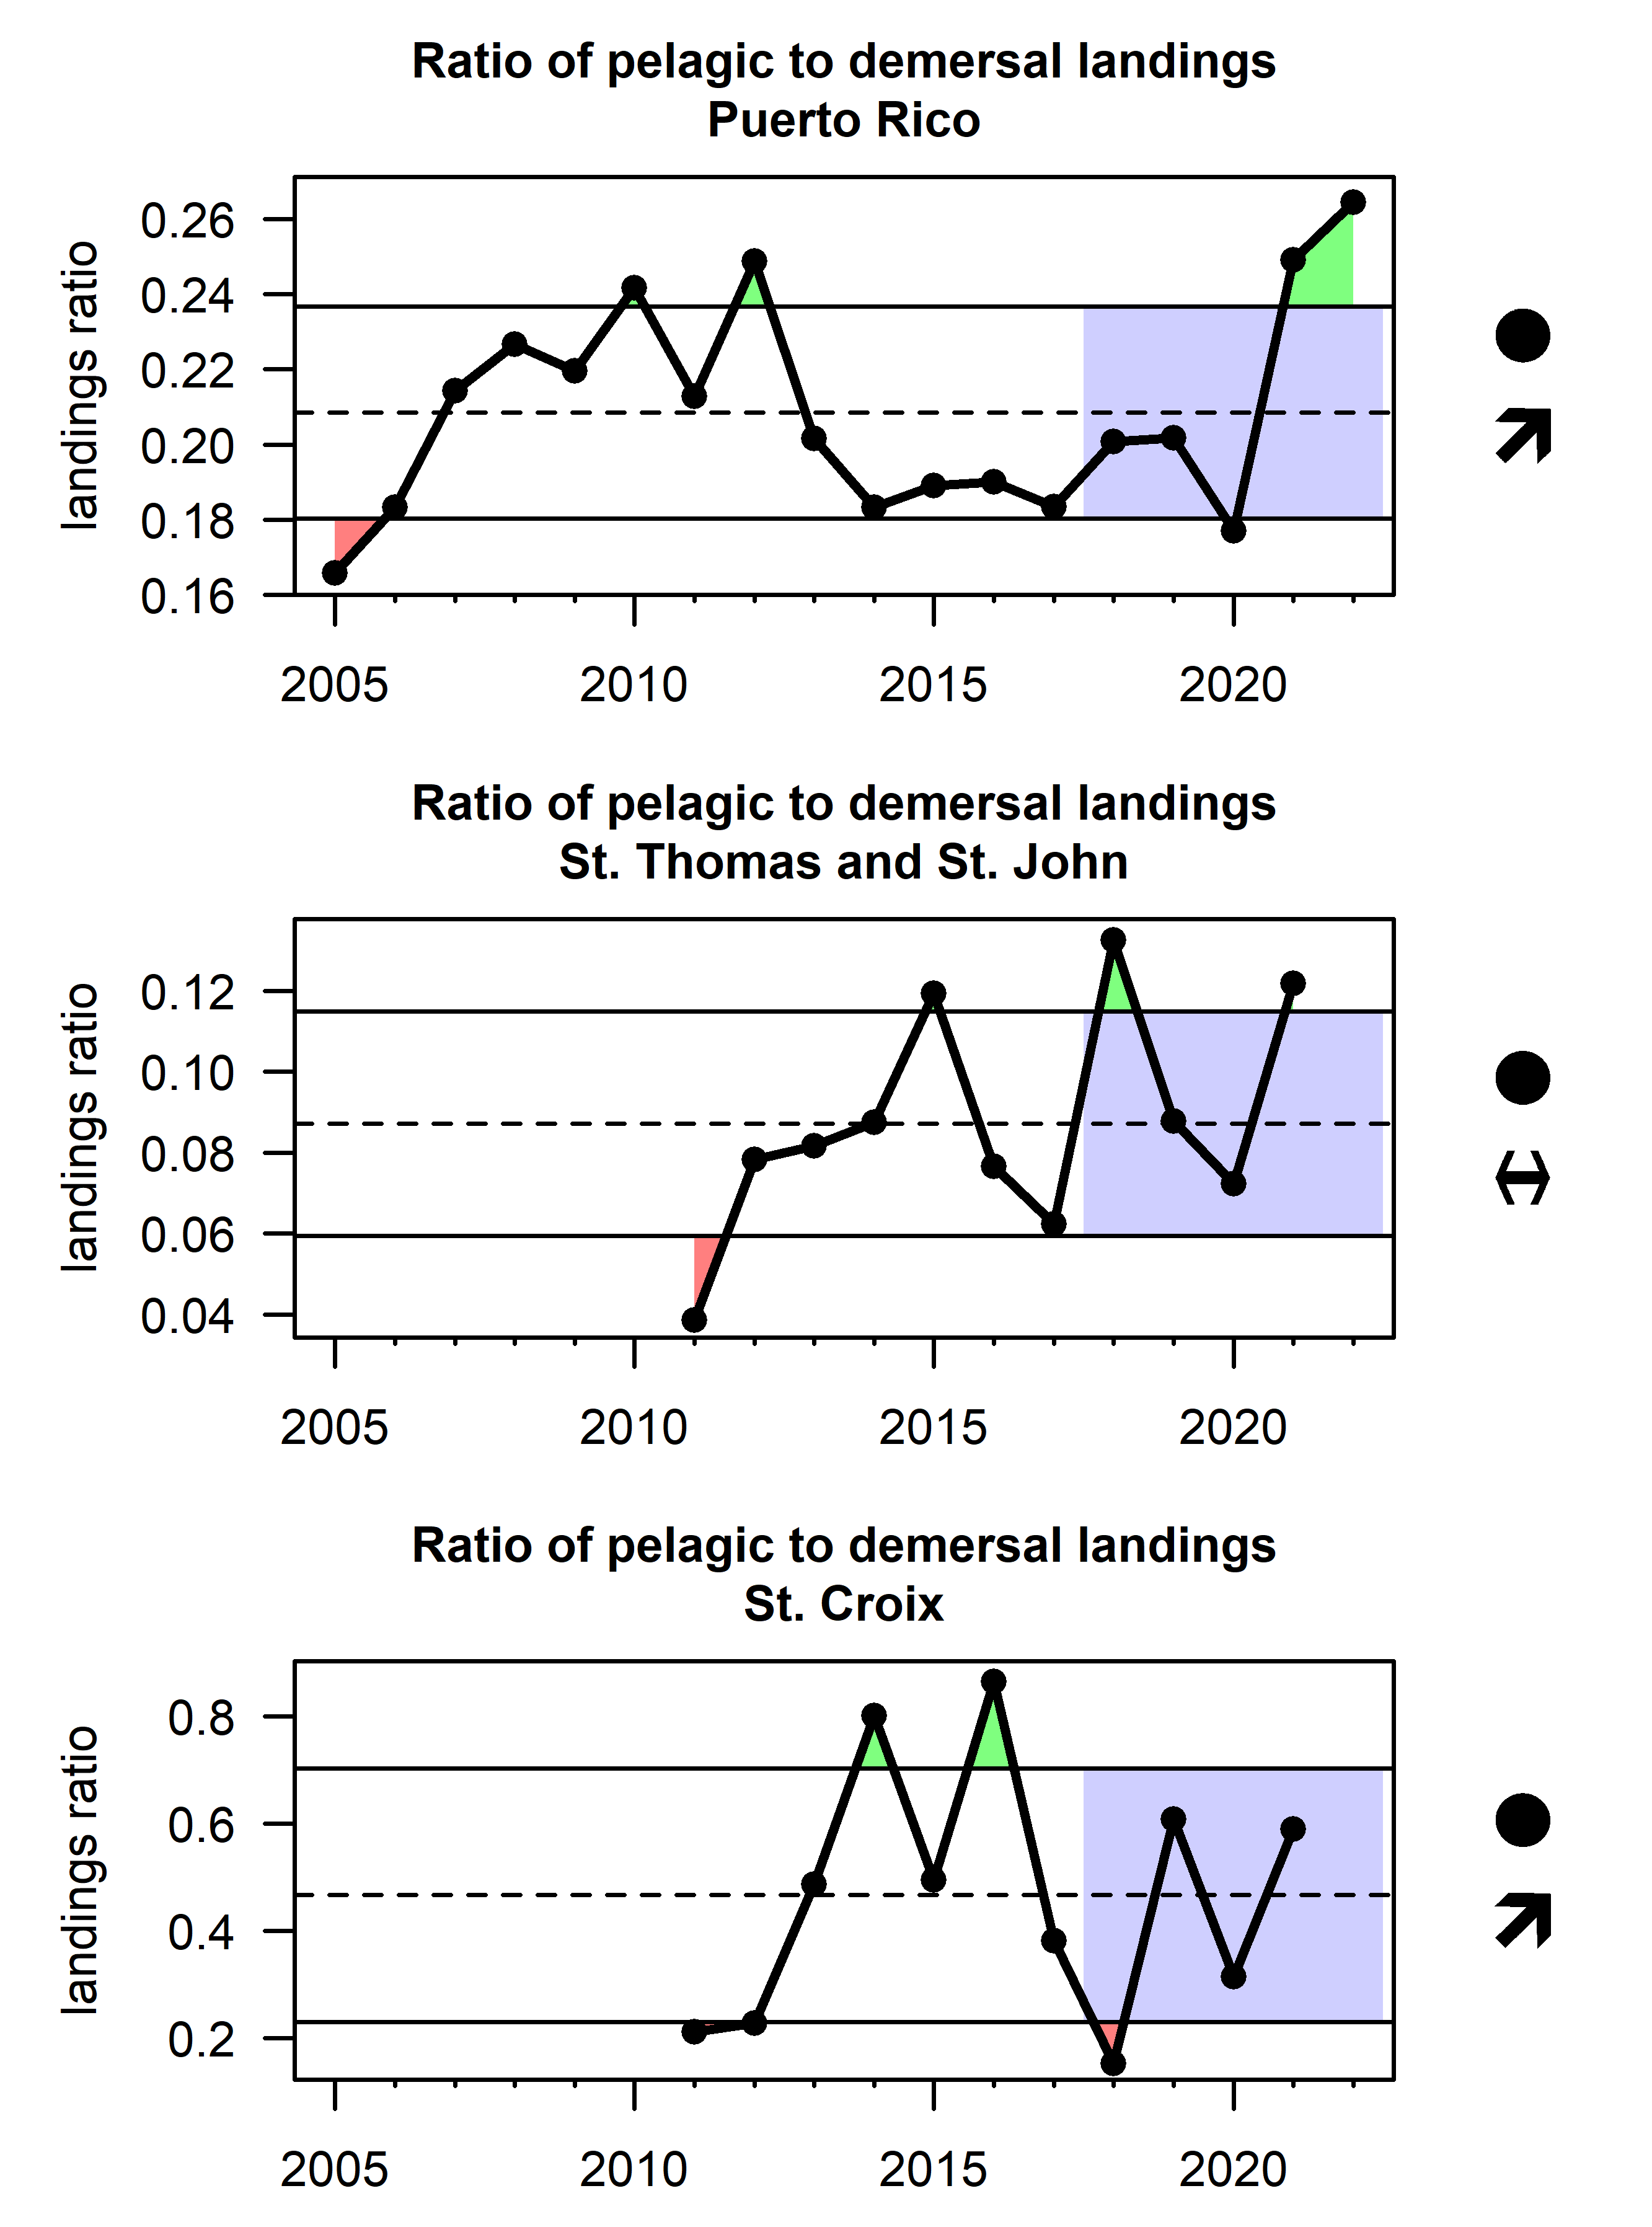
The ratio of pelagic to demersal species in the landings is thought to be responsive to nutrient inputs and the quality of benthic habitat in marine ecosystems (de Leiva Moreno et al. 2000); in the context of small islands in the tropical seas, it may convey the availability and productivity of pelagic habitats relative to the size of the shelf and productivity of coral reef habitats. Ratios of pelagic to demersal landings were calculated based on total pounds reported in the Caribbean Commercial Landings data, following a classification of all species based on their reported ecology in FishBase (Froese and Pauly 2024). In St. Croix, the pelagic-demersal ratio is much higher than the other islands, due to the small shelf area and limited availability of reef habitat; interannual fluctuations for this island are largely influenced by landings of dolphinfish and tunas. In Puerto Rico, the pelagic-demersal ratio has decreased in recent years; this may be partially due to changes in reporting that occurred in 2020 (addition of electronic reporting option). In St. Thomas and St. John, the ratio has fluctuated over time; the large peak in the 2018–2019 fishing year could have been a result of hurricane-induced reef habitat loss and subsequent reduction in landings of demersal fish species (Figure 2.5).
2.1.3 Maximum length in the landings
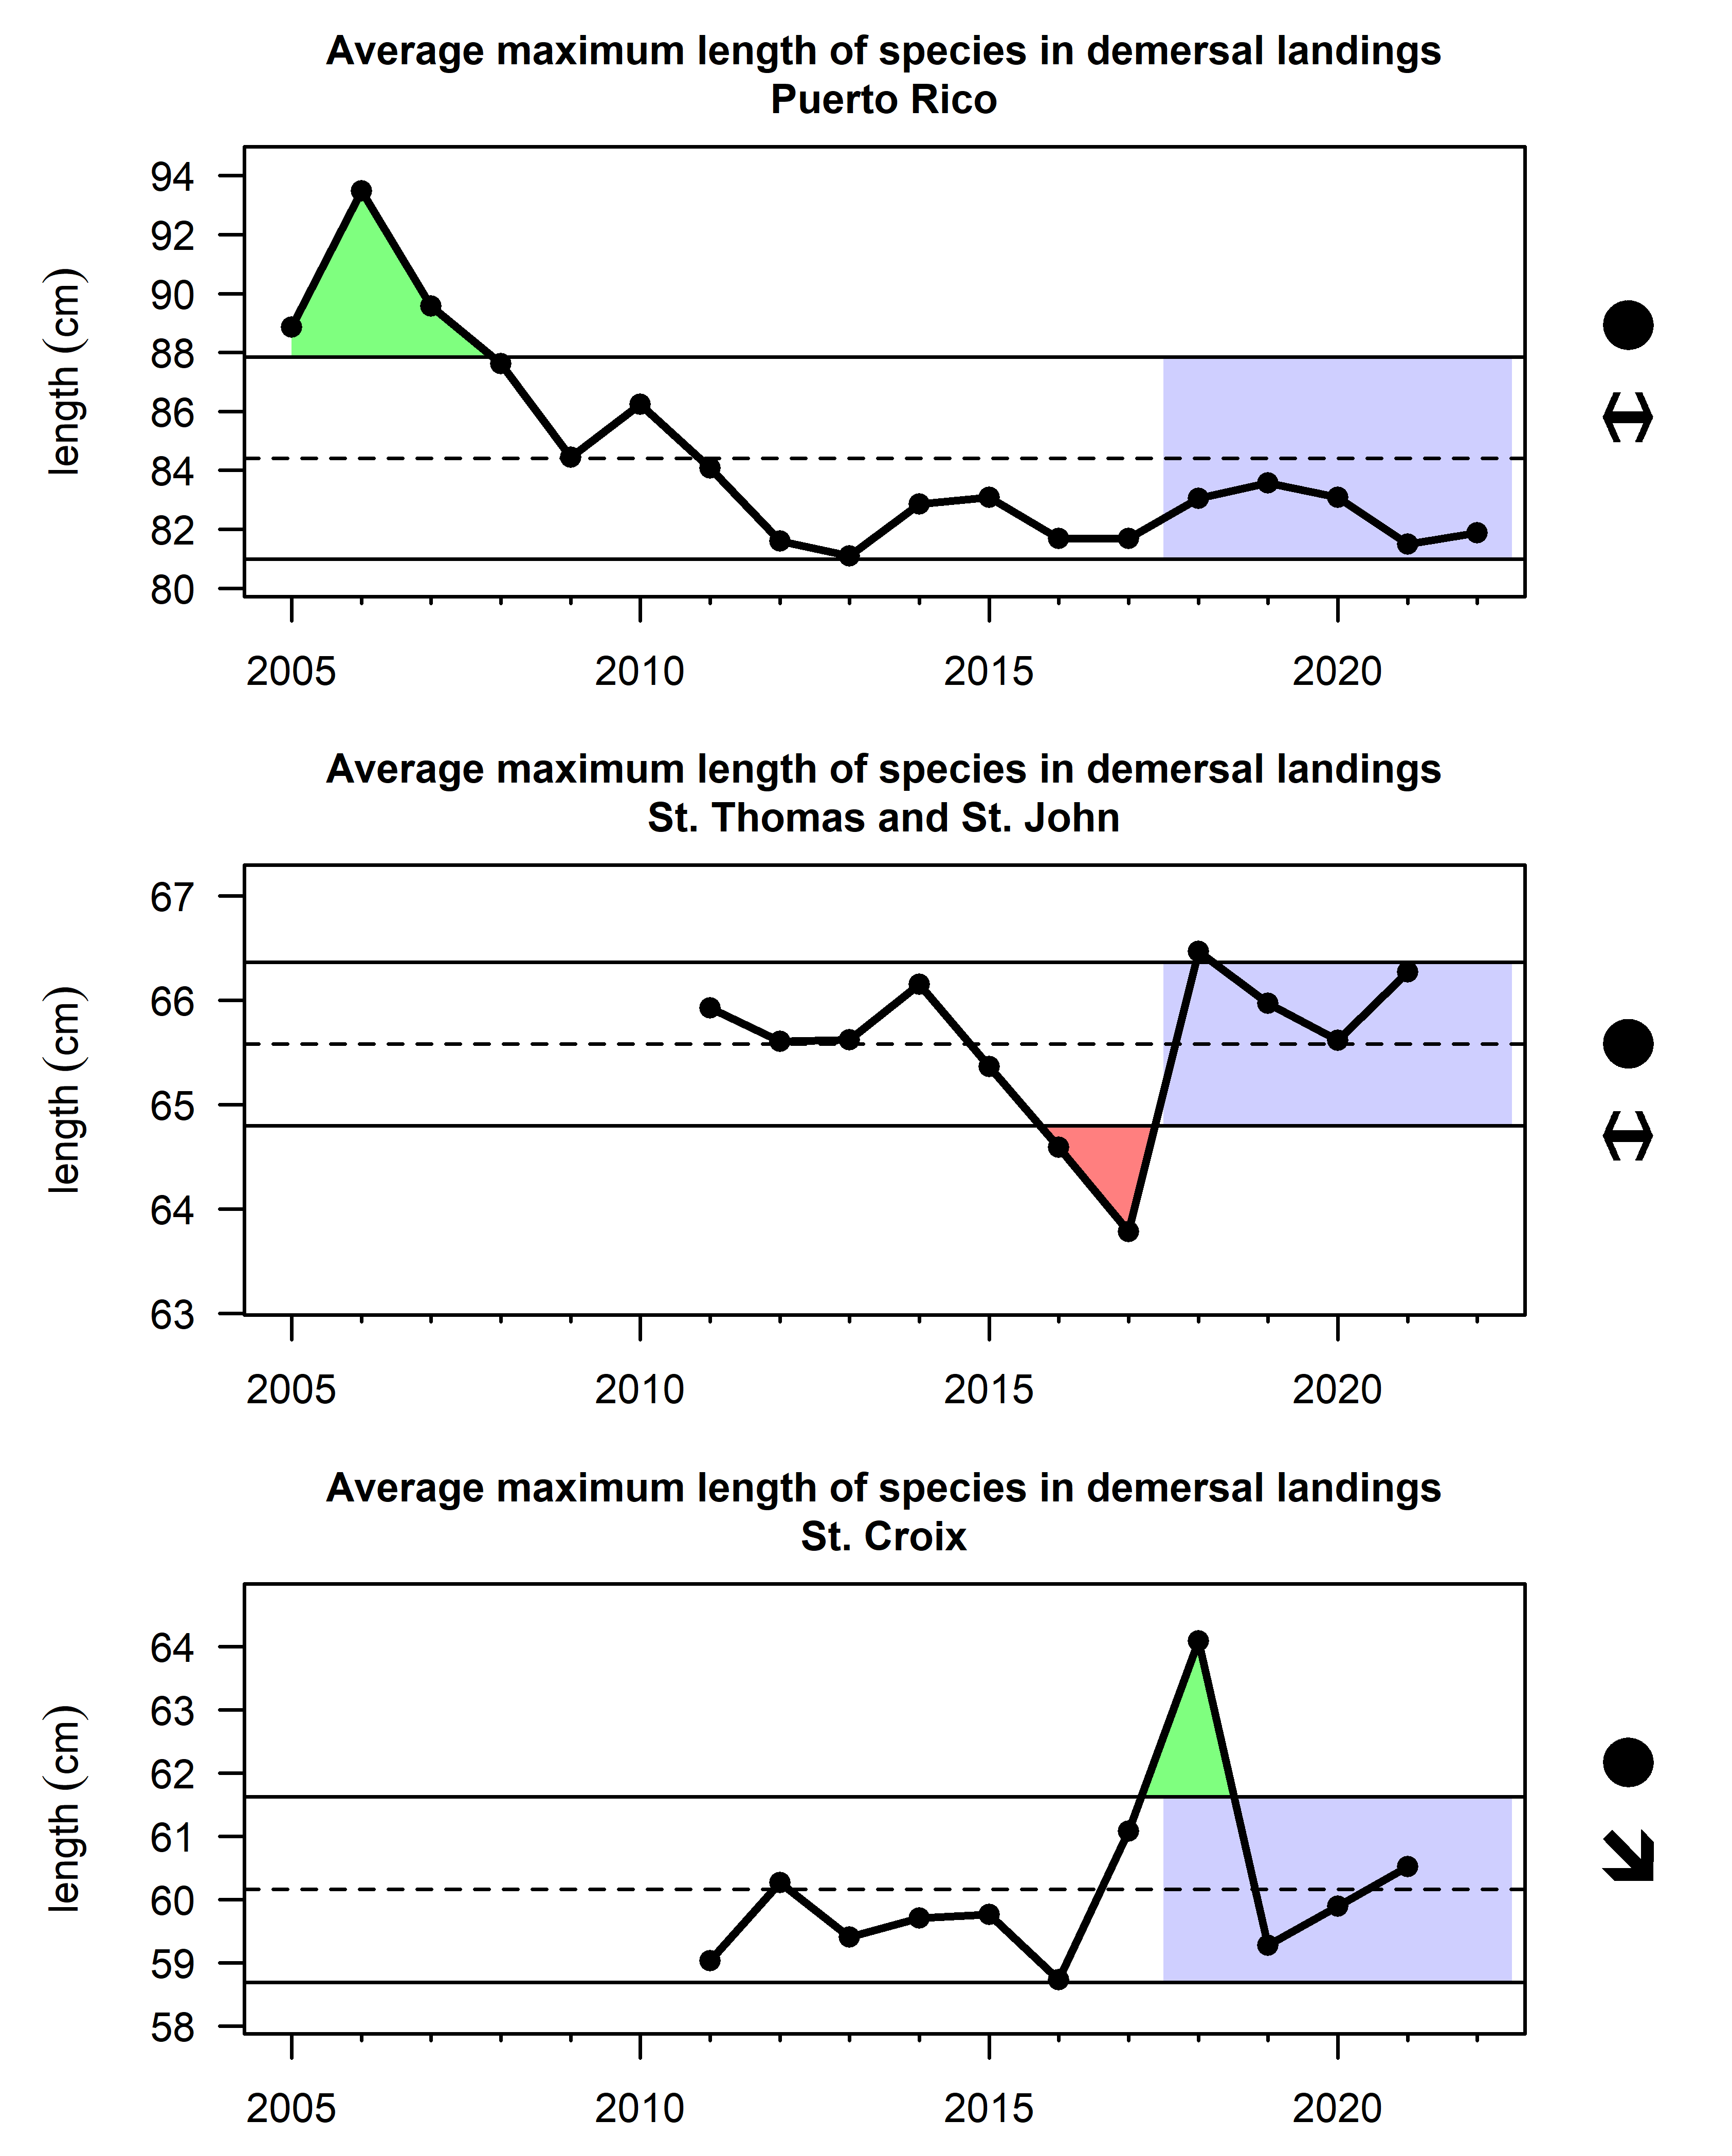
The average maximum length (Lmax) of a species in the landings has been proposed as an indicator of whether large-bodied species have been depleted and are no longer fished (Rochet and Trenkel 2003). The Lmax indicator is derived by assigning a maximum body length for each species (as reported in FishBase) and then calculating the average maximum body length weighted by the total landings in each year (based on the Caribbean Commercial Landings database). This analysis was limited to demersal species only, as pelagic species tend to be larger-bodied and the index would otherwise be highly correlated with the pelagic-demersal ratio. The average maximum length in the demersal landings decreased over time in Puerto Rico from 2005–2012, but has been relatively stable since (Figure 2.6). In the USVI, there has been no long-term trend in the Lmax indicator, though it has increased in recent years. There was a sharp decline in average maximum length in St. Thomas and St. John in the 2017–2018 fishing year and a sharp increase in St. Croix in the 2018–2019 fishing year; these changes may reflect shifts in fishing behavior tied to impacts from the 2017 hurricanes.
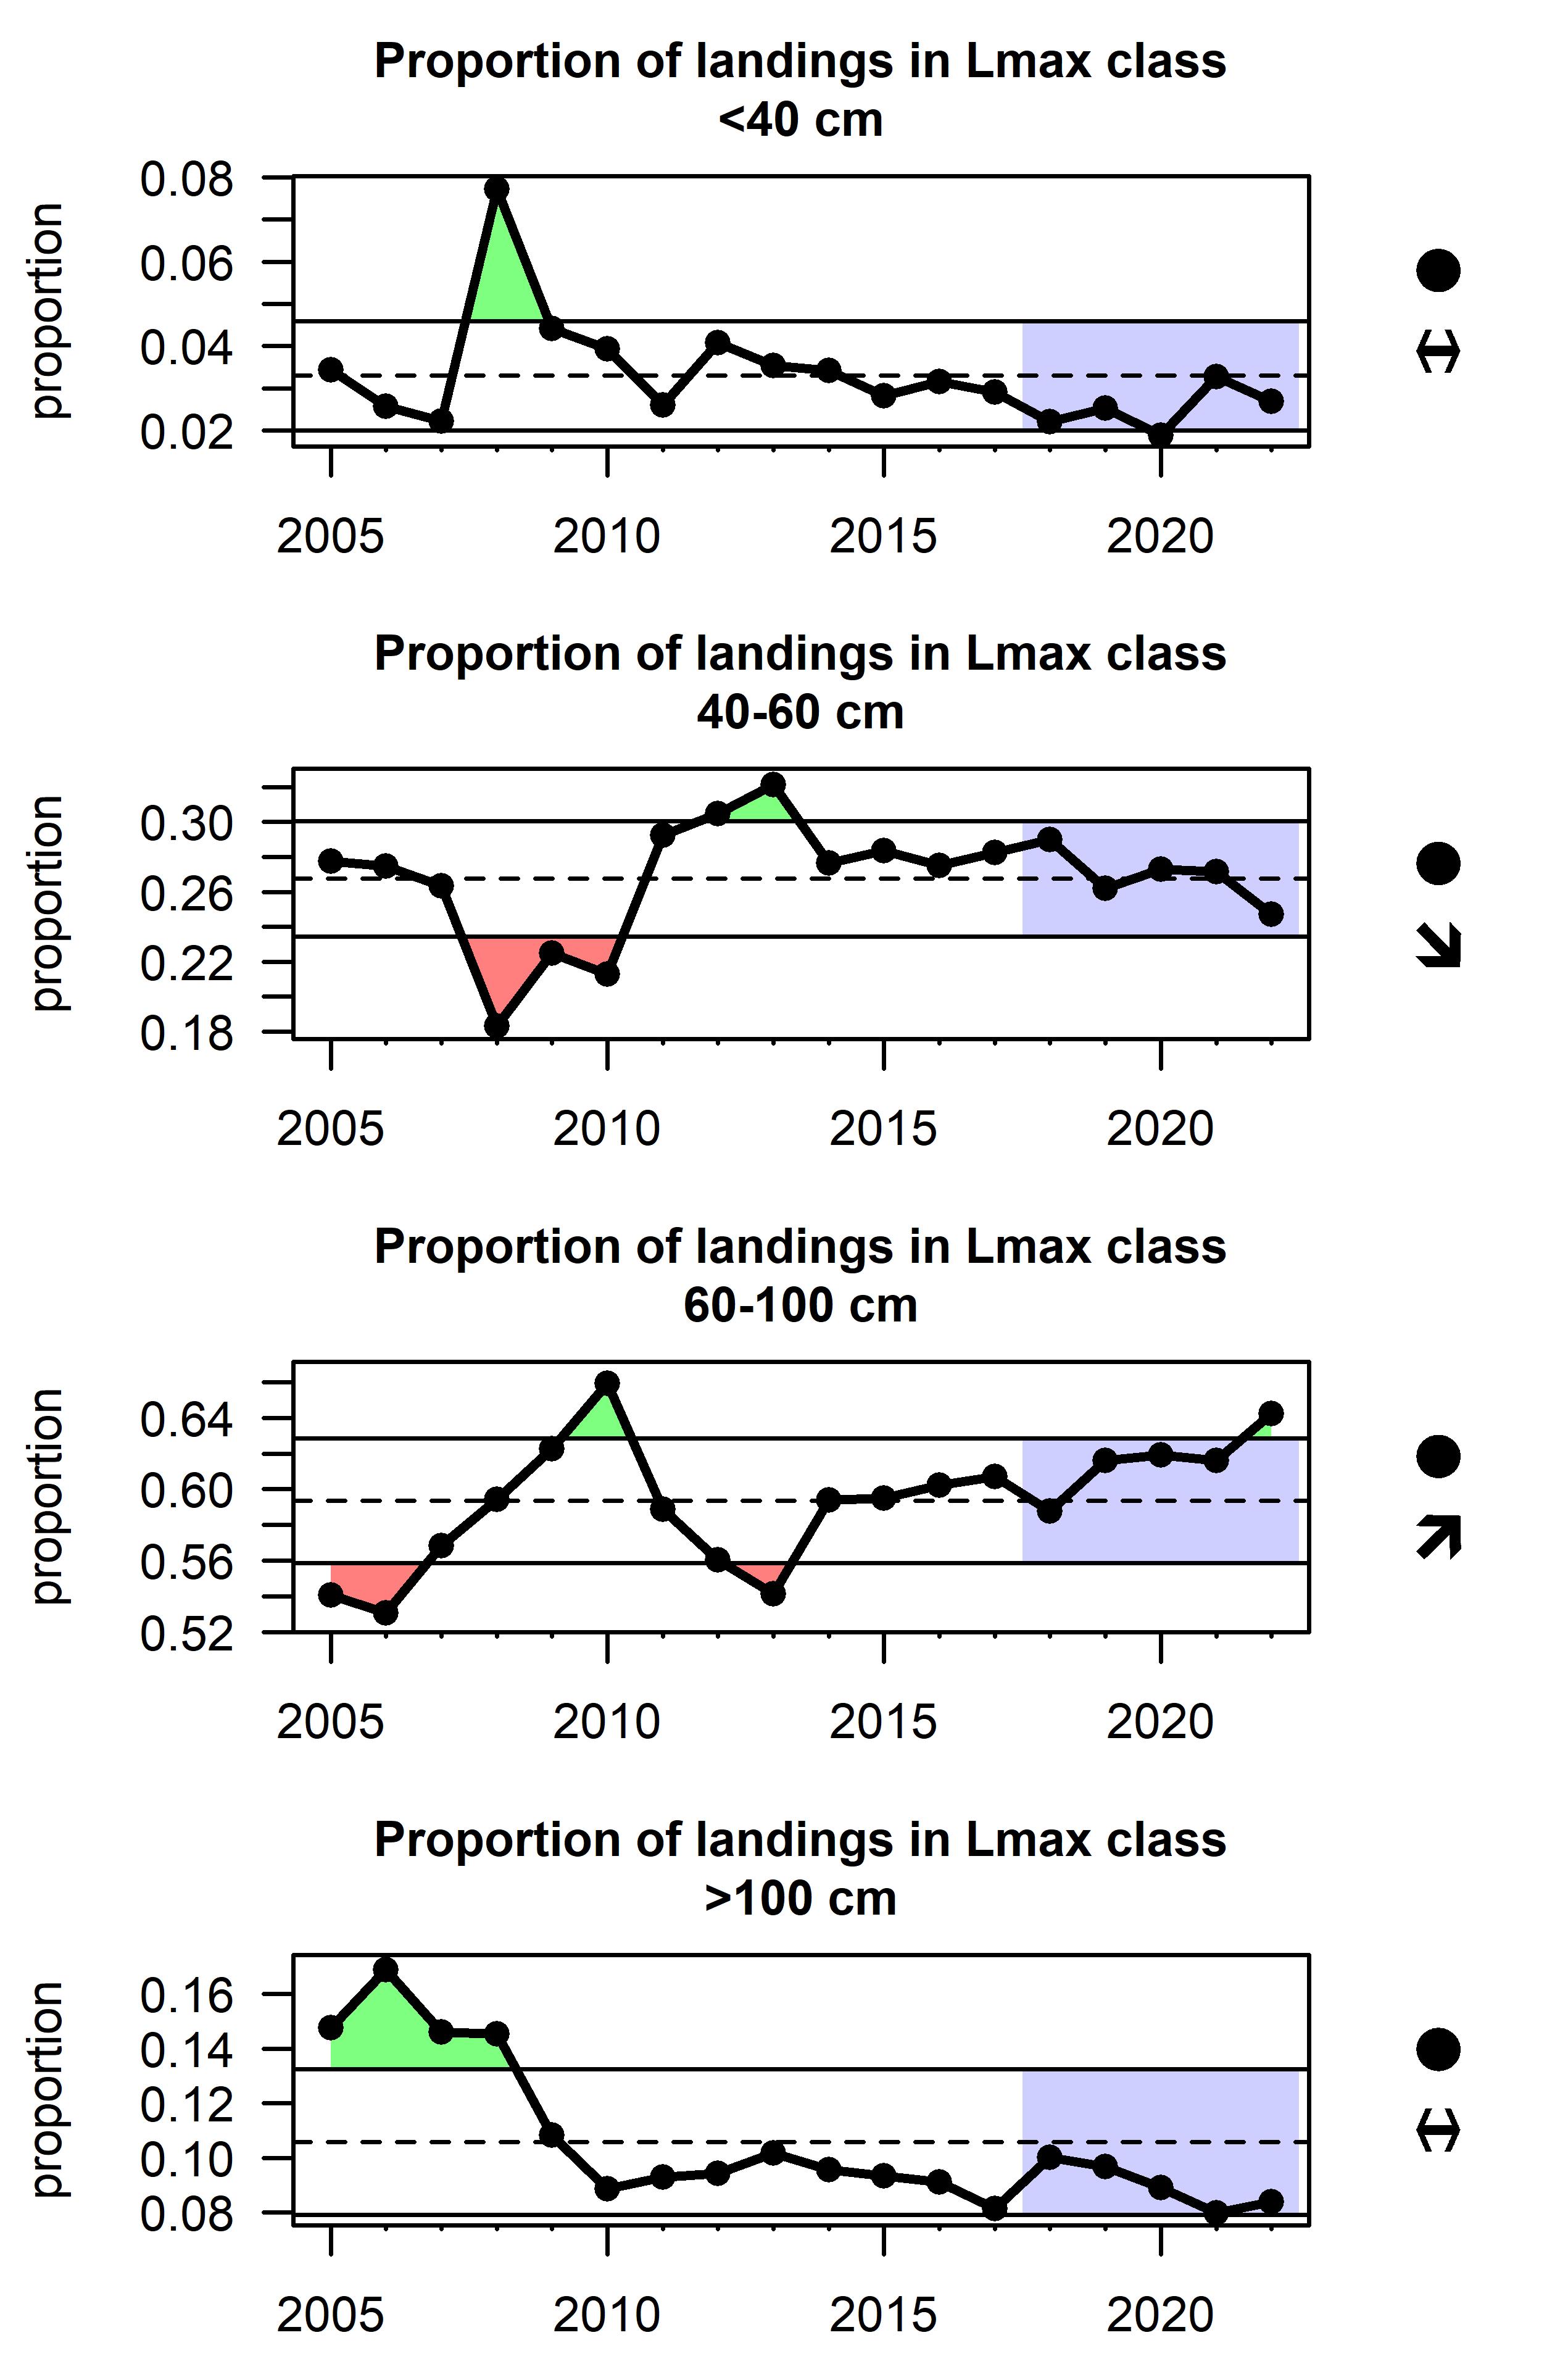
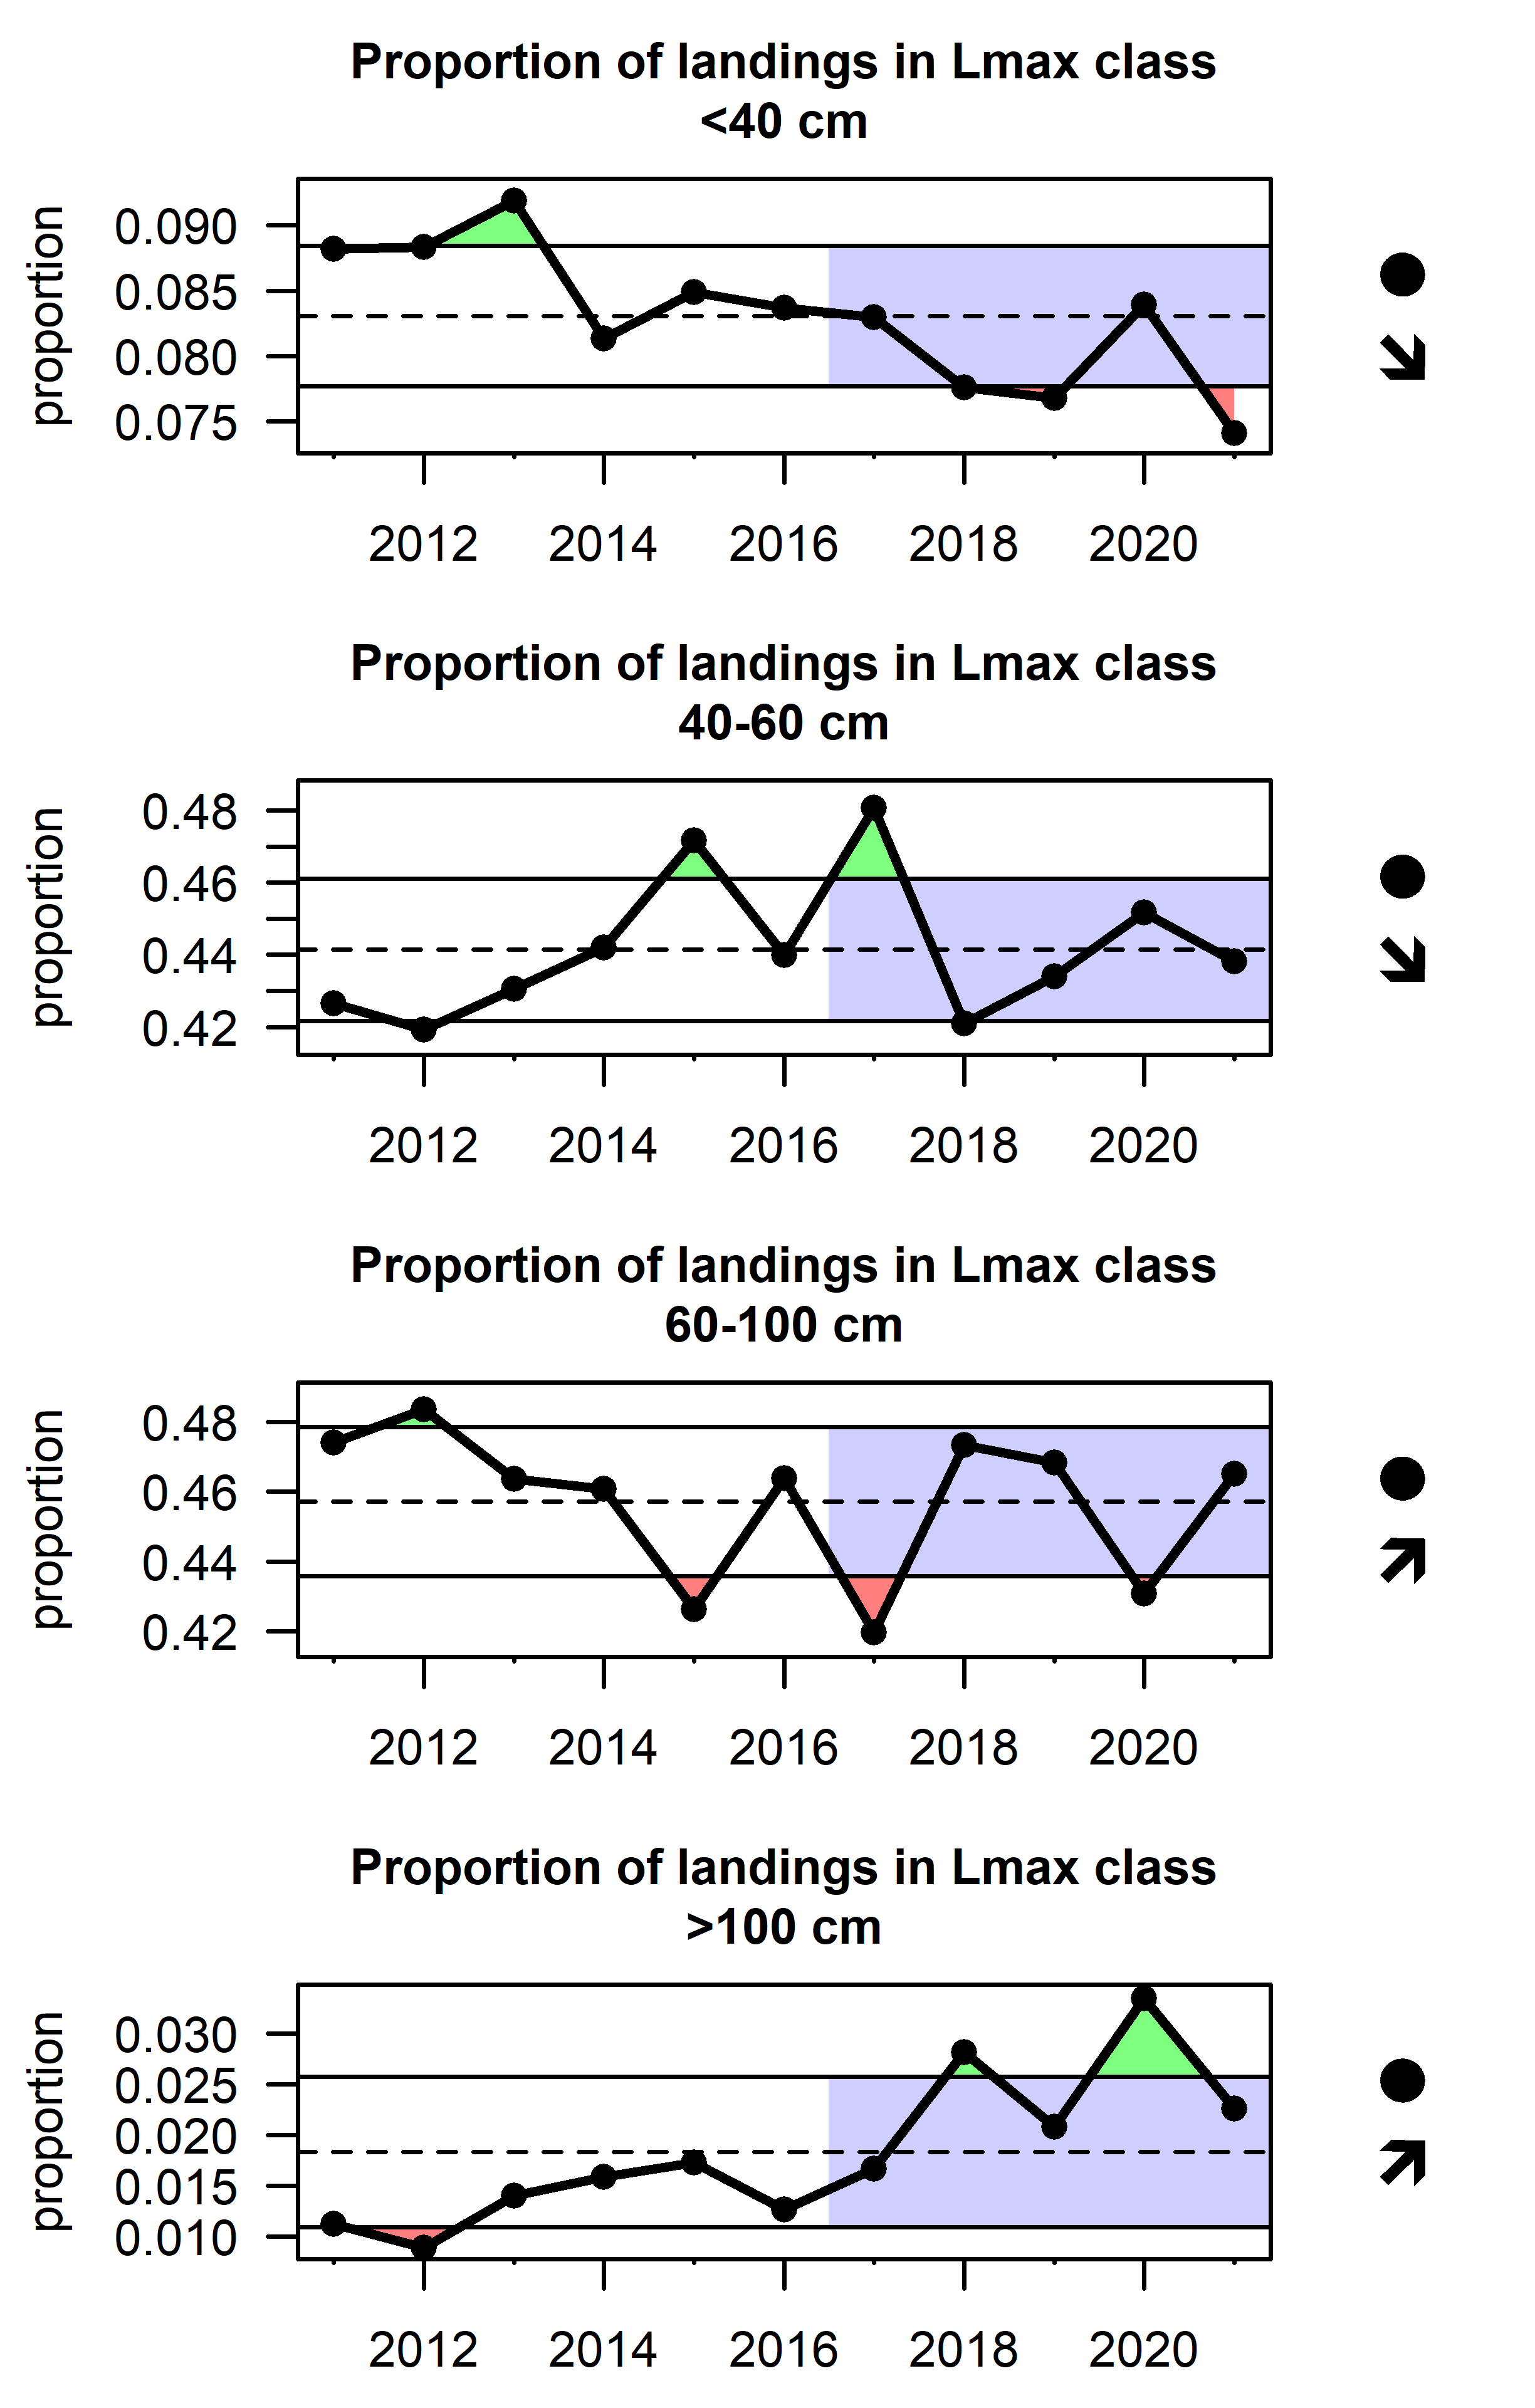
The proportion of landings within different Lmax classes can also be shown to better understand changes driving the average Lmax indicator. In Puerto Rico, there is a generally increasing trend of “plate-sized” fish in the 60-100cm category which is driven by increased landings of deepwater snapper species, yellowtail snapper, and red hind, while a decrease in the >100cm Lmax group is driven by declining landings of large-bodied parrotfishes, snook, and some large groupers (Figure 2.7). Recent decreases in the 40-60cm Lmax group are driven by landings of lane snapper and queen triggerfish.
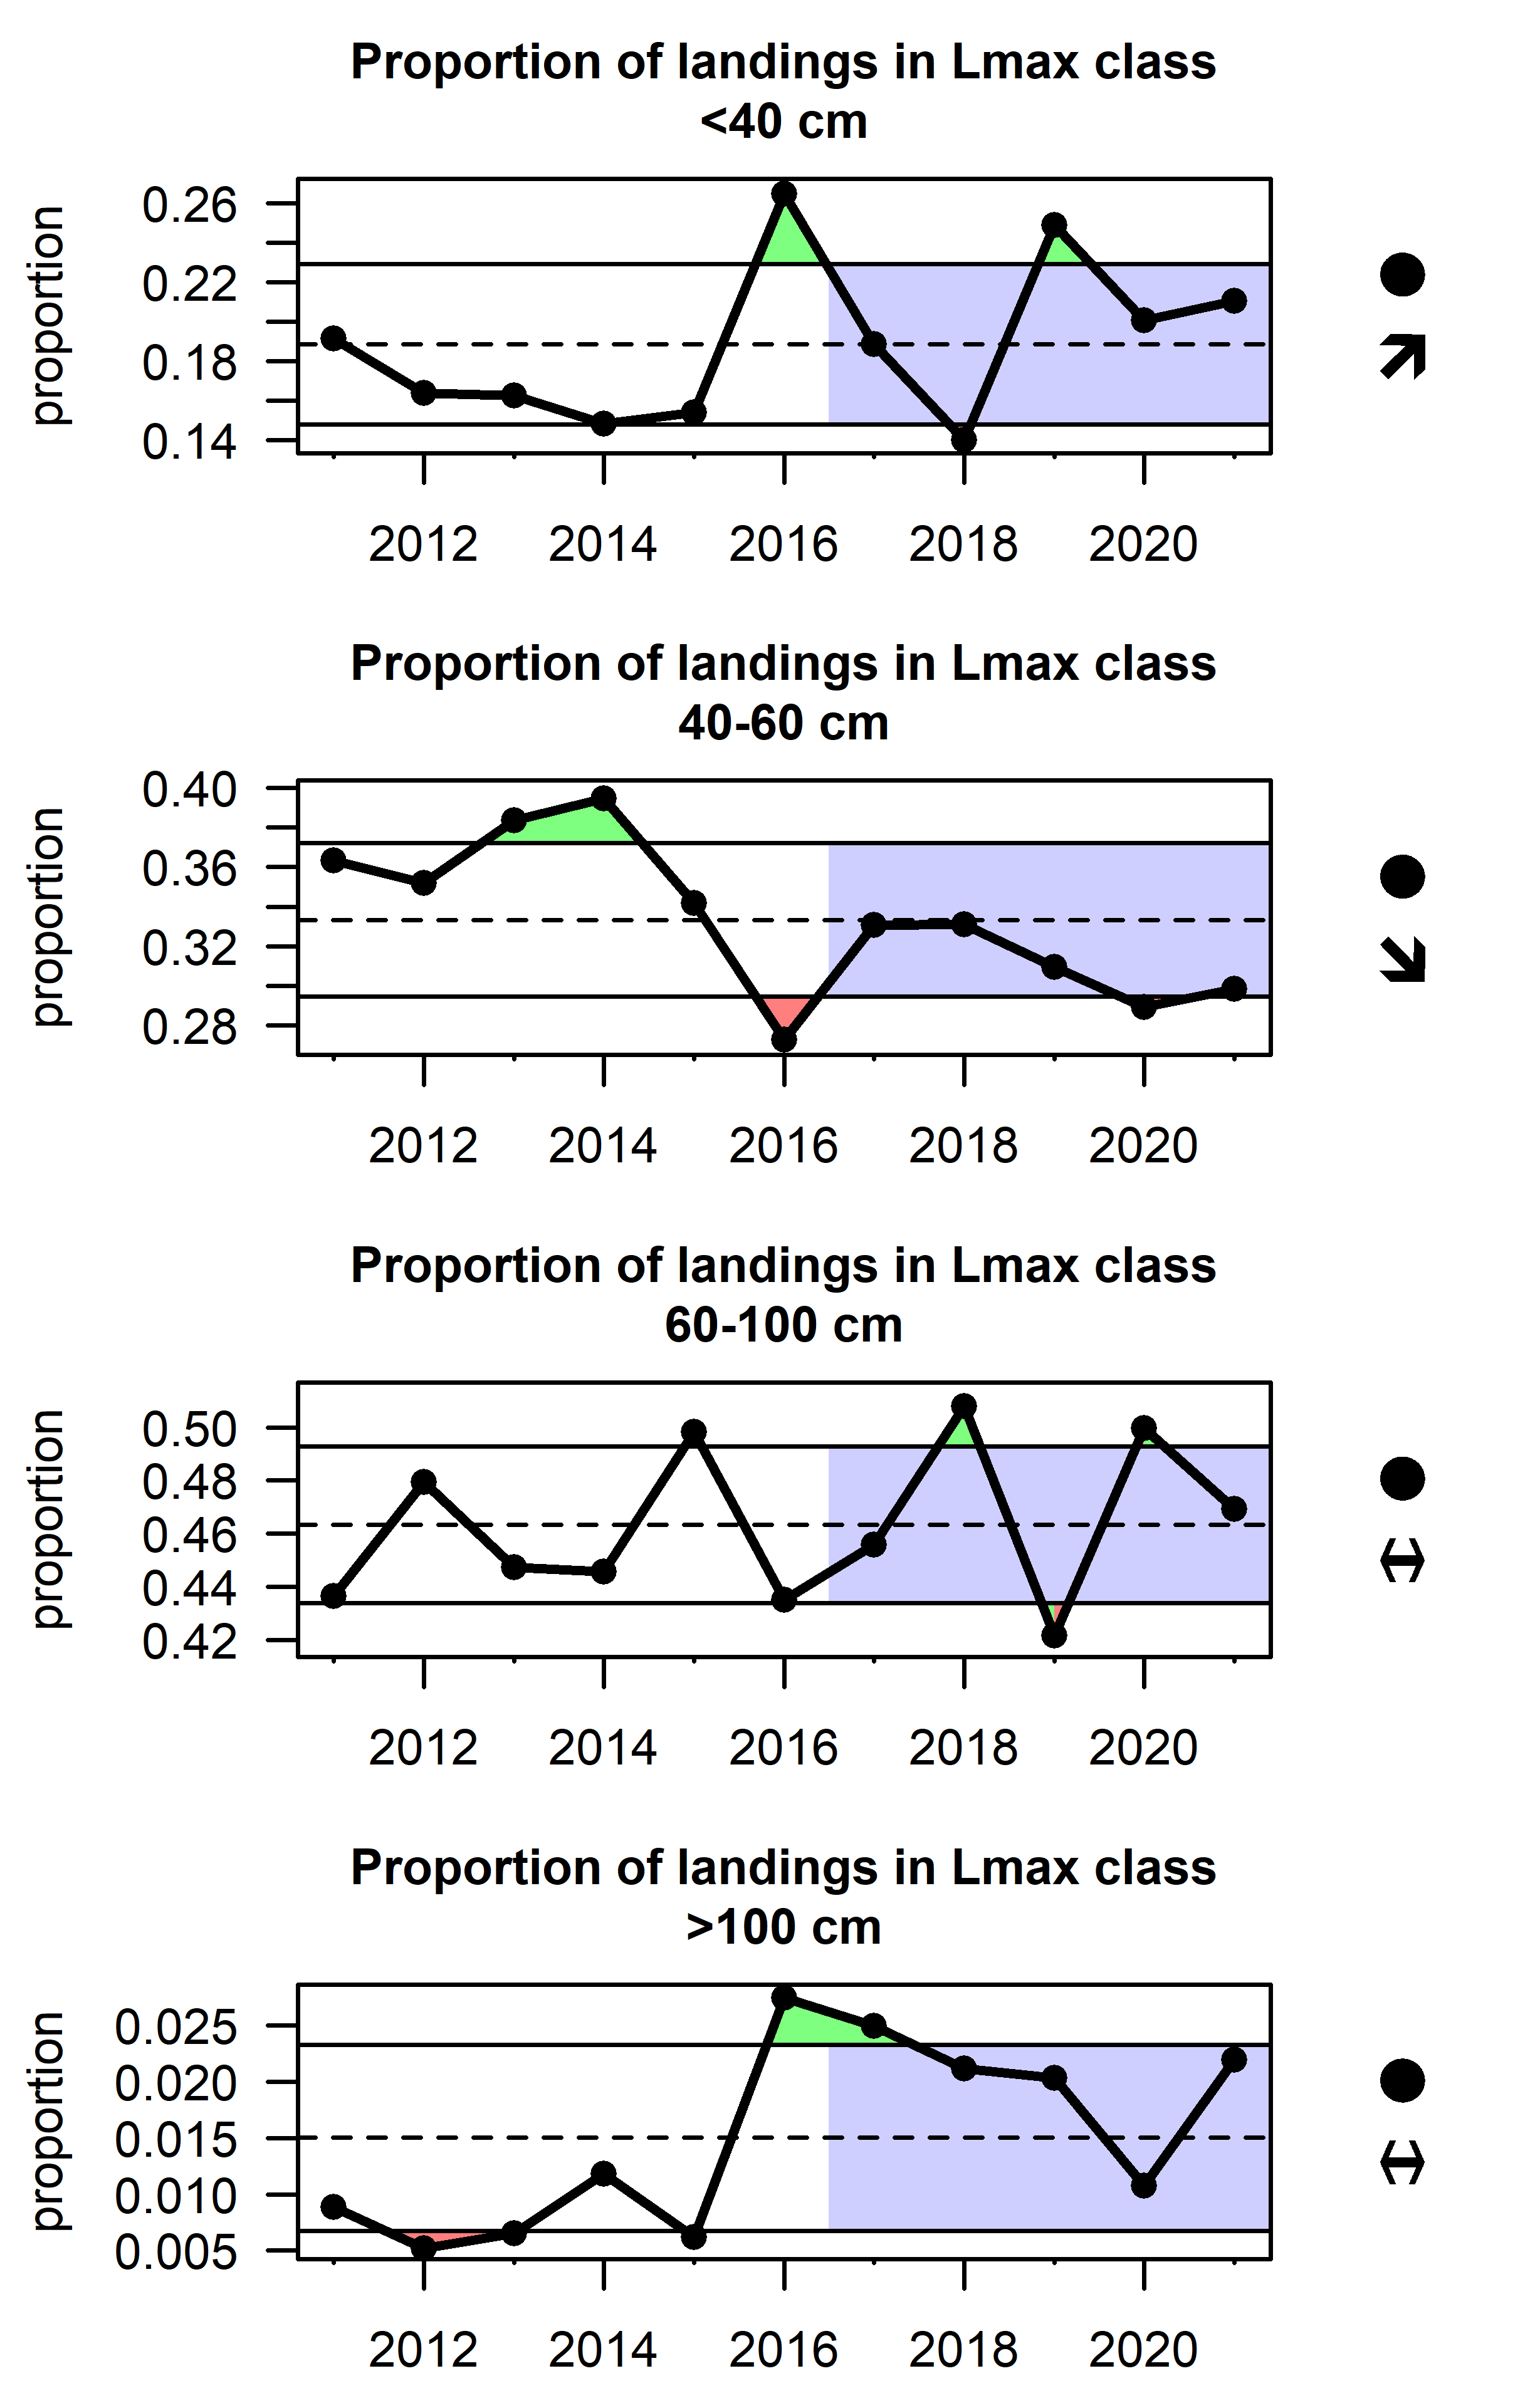
In St. Thomas there is a notable decrease in the smallest size class (dominated by landings of surgeonfishes and longspine squirrelfish) as well as a recent decrease in the 40-60cm Lmax group, driven by landings of queen triggerfish, gray angelfish, and white grunt. Landings in the 60-100cm Lmax group have increased recently and are influenced by landings of red hind, yellowtail snapper and blue runner (Figure 2.8).
In St. Croix, changes in the maximum body size of demersal species landings is being influenced primarily by changes in the targeting of parrotfishes. The <40cm Lmax group includes redband parrotfish and princess parrotfish and has decreased in recent years, while the 40-60cm Lmax class, composed of redfin and redtail parrotfish, has remained below average but stable. The 60-100cm Lmax class has increased recently and is driven by landings of stoplight and queen parrotfish (Figure 2.9).
2.1.4 Commercial landings
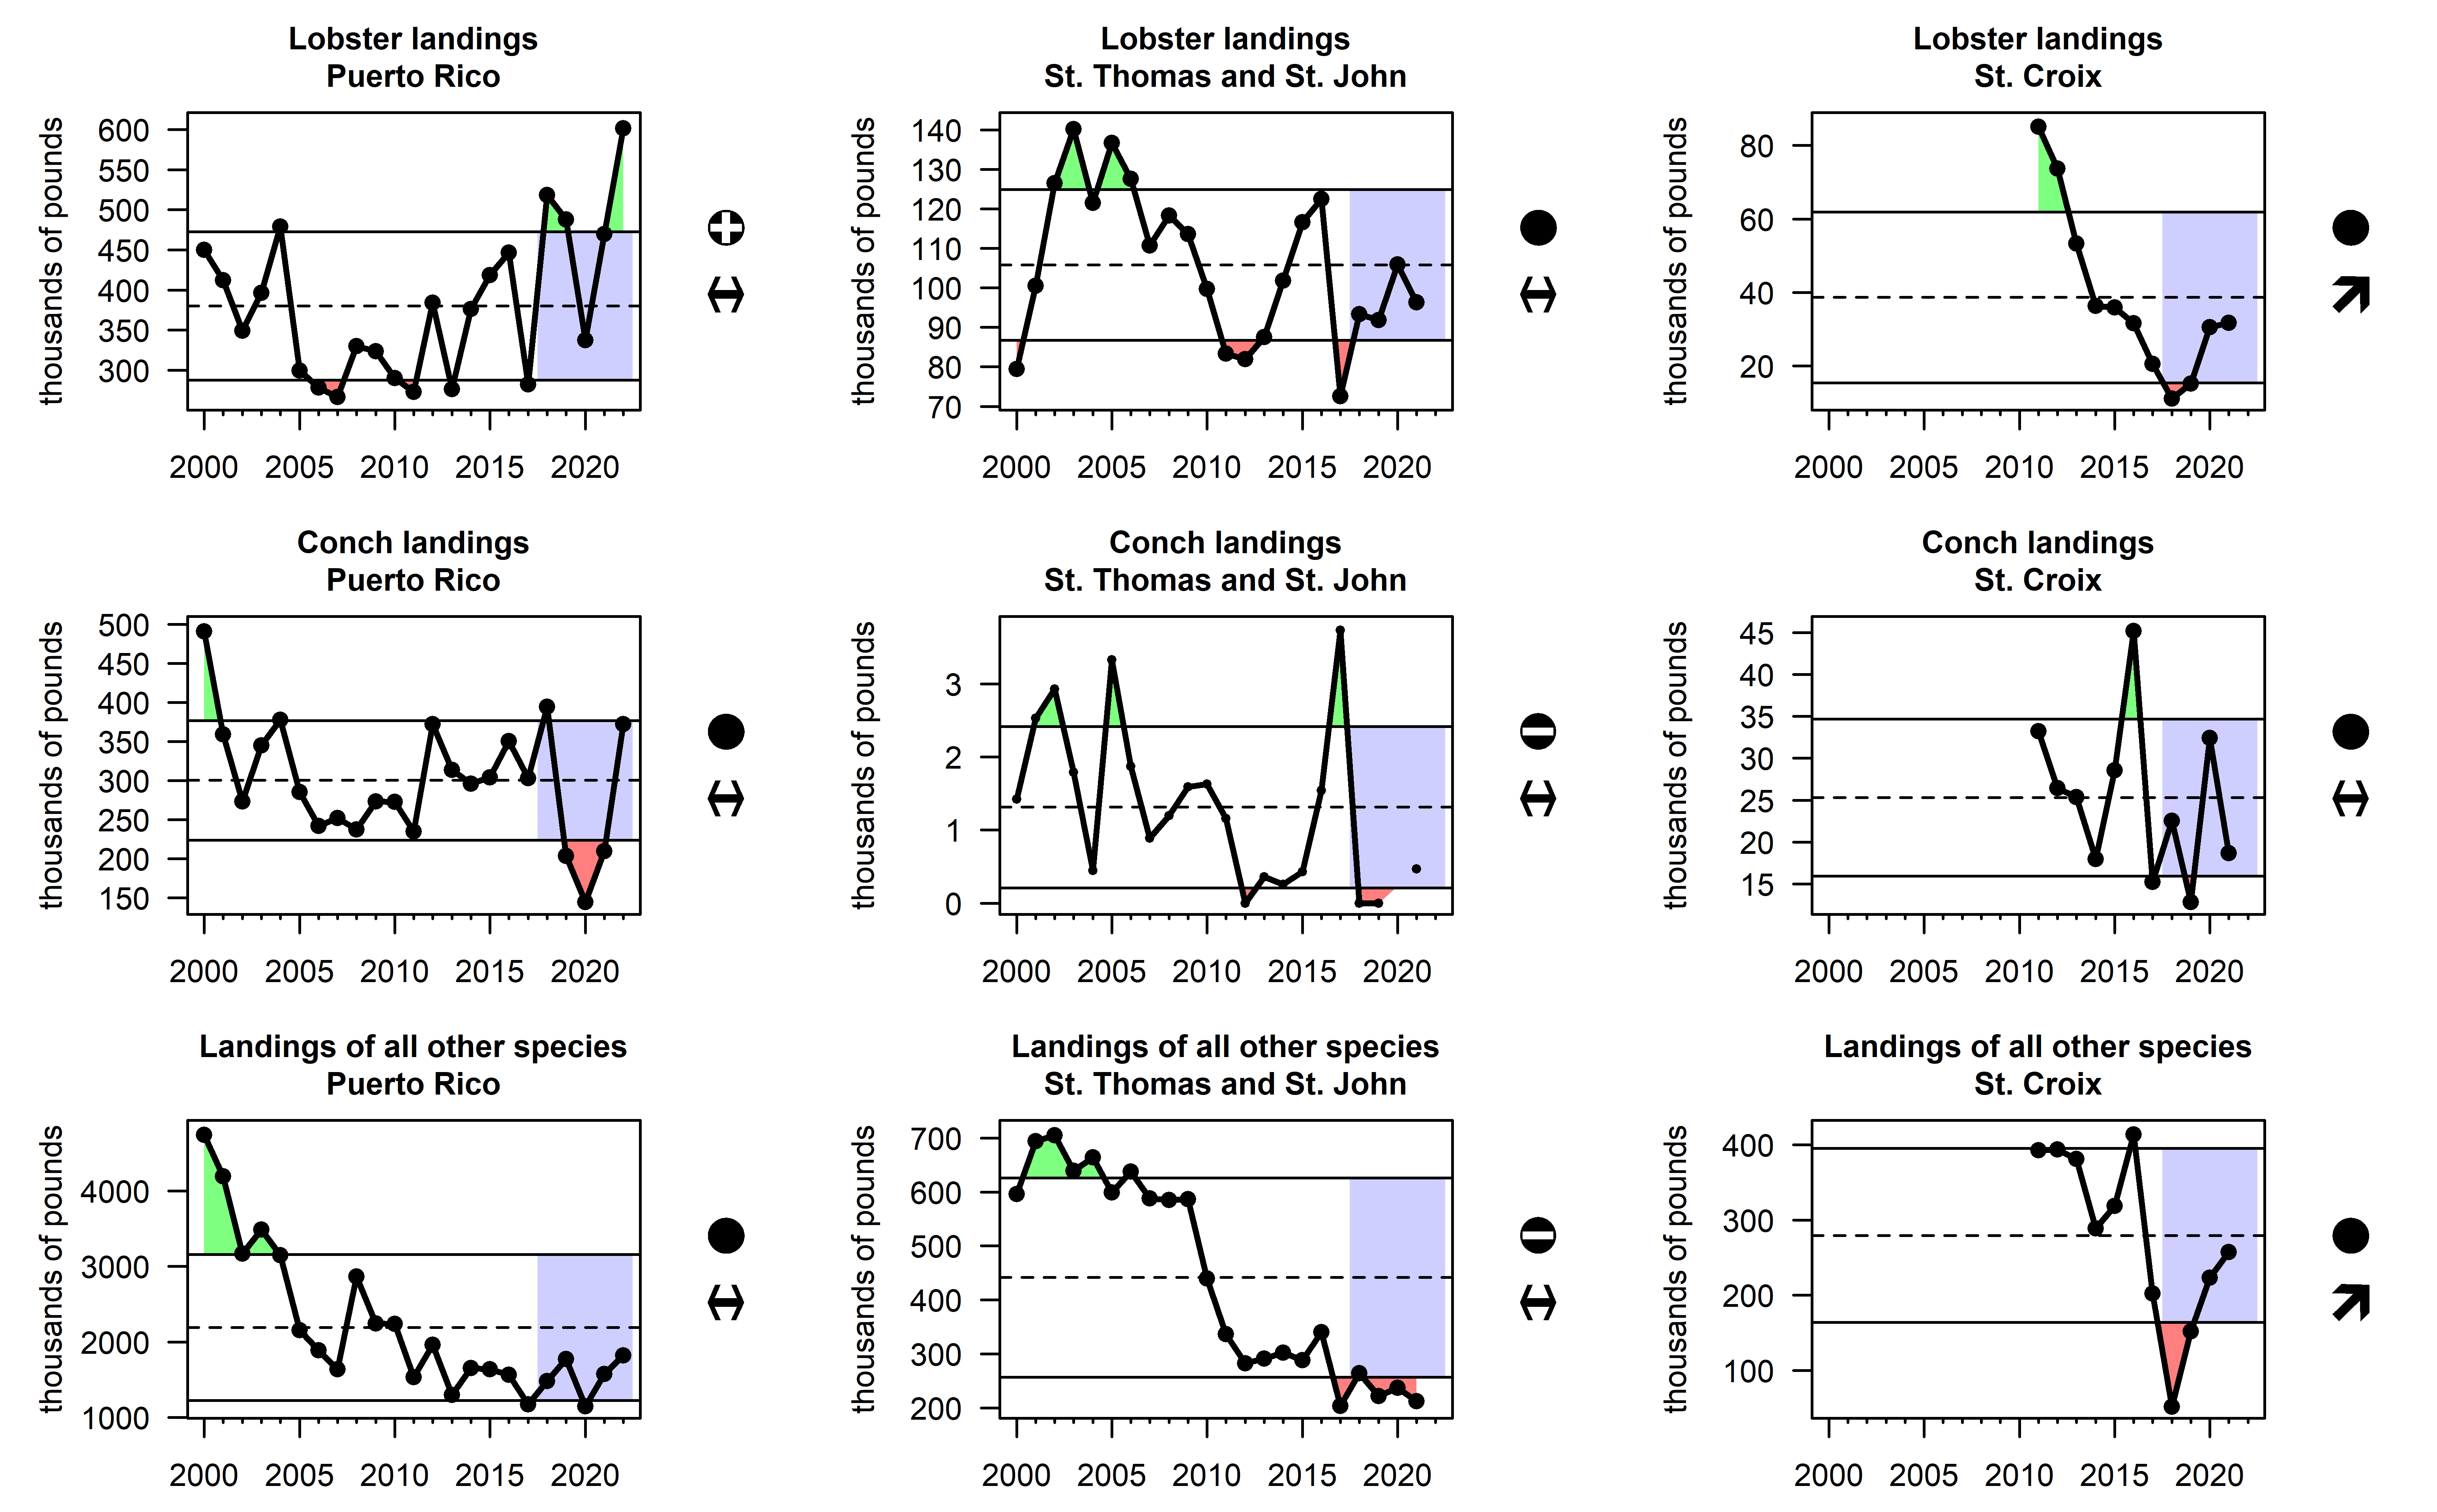
Total landings of conch, lobster, and finfish indicate the ability of U.S. Caribbean fisheries to provide food and revenues, and may be driven by a combination of trends in underlying abundance, market demand, fishing effort, and regulations. Self-reported landings from the Caribbean Commercial Landings Data were compiled; data were originally compiled by paper logbooks, but starting in 2020 some trips in Puerto Rico were reported using electronic reporting (a mobile application). Since 2005, lobster landings have increased in Puerto Rico, fluctuated in St. Thomas and St. John, and decreased in St. Croix, with particularly low values in 2017–2018 for St. Thomas and 2018–2019 for St. Croix. Conch landings have been variable with little trend over time, though there was a sudden decrease in Puerto Rico conch landings in 2020 and recent landings are well below average. Note that harvest of queen conch is prohibited in federal waters around Puerto Rico and St. Thomas/St. John, though they are allowed in territorial waters, during their respective open seasons. Landings of other species have decreased significantly over time, particularly starting in 2010 (Figure 2.10). This coincides with initial implementation of annual catch limits in U.S. Caribbean federal waters and may be caused by changes in reporting rather than true reductions in landings. Recent landings of other species are well below the long-term average in the USVI.
2.2 Socioeconomic health
2.2.1 Commercial revenues
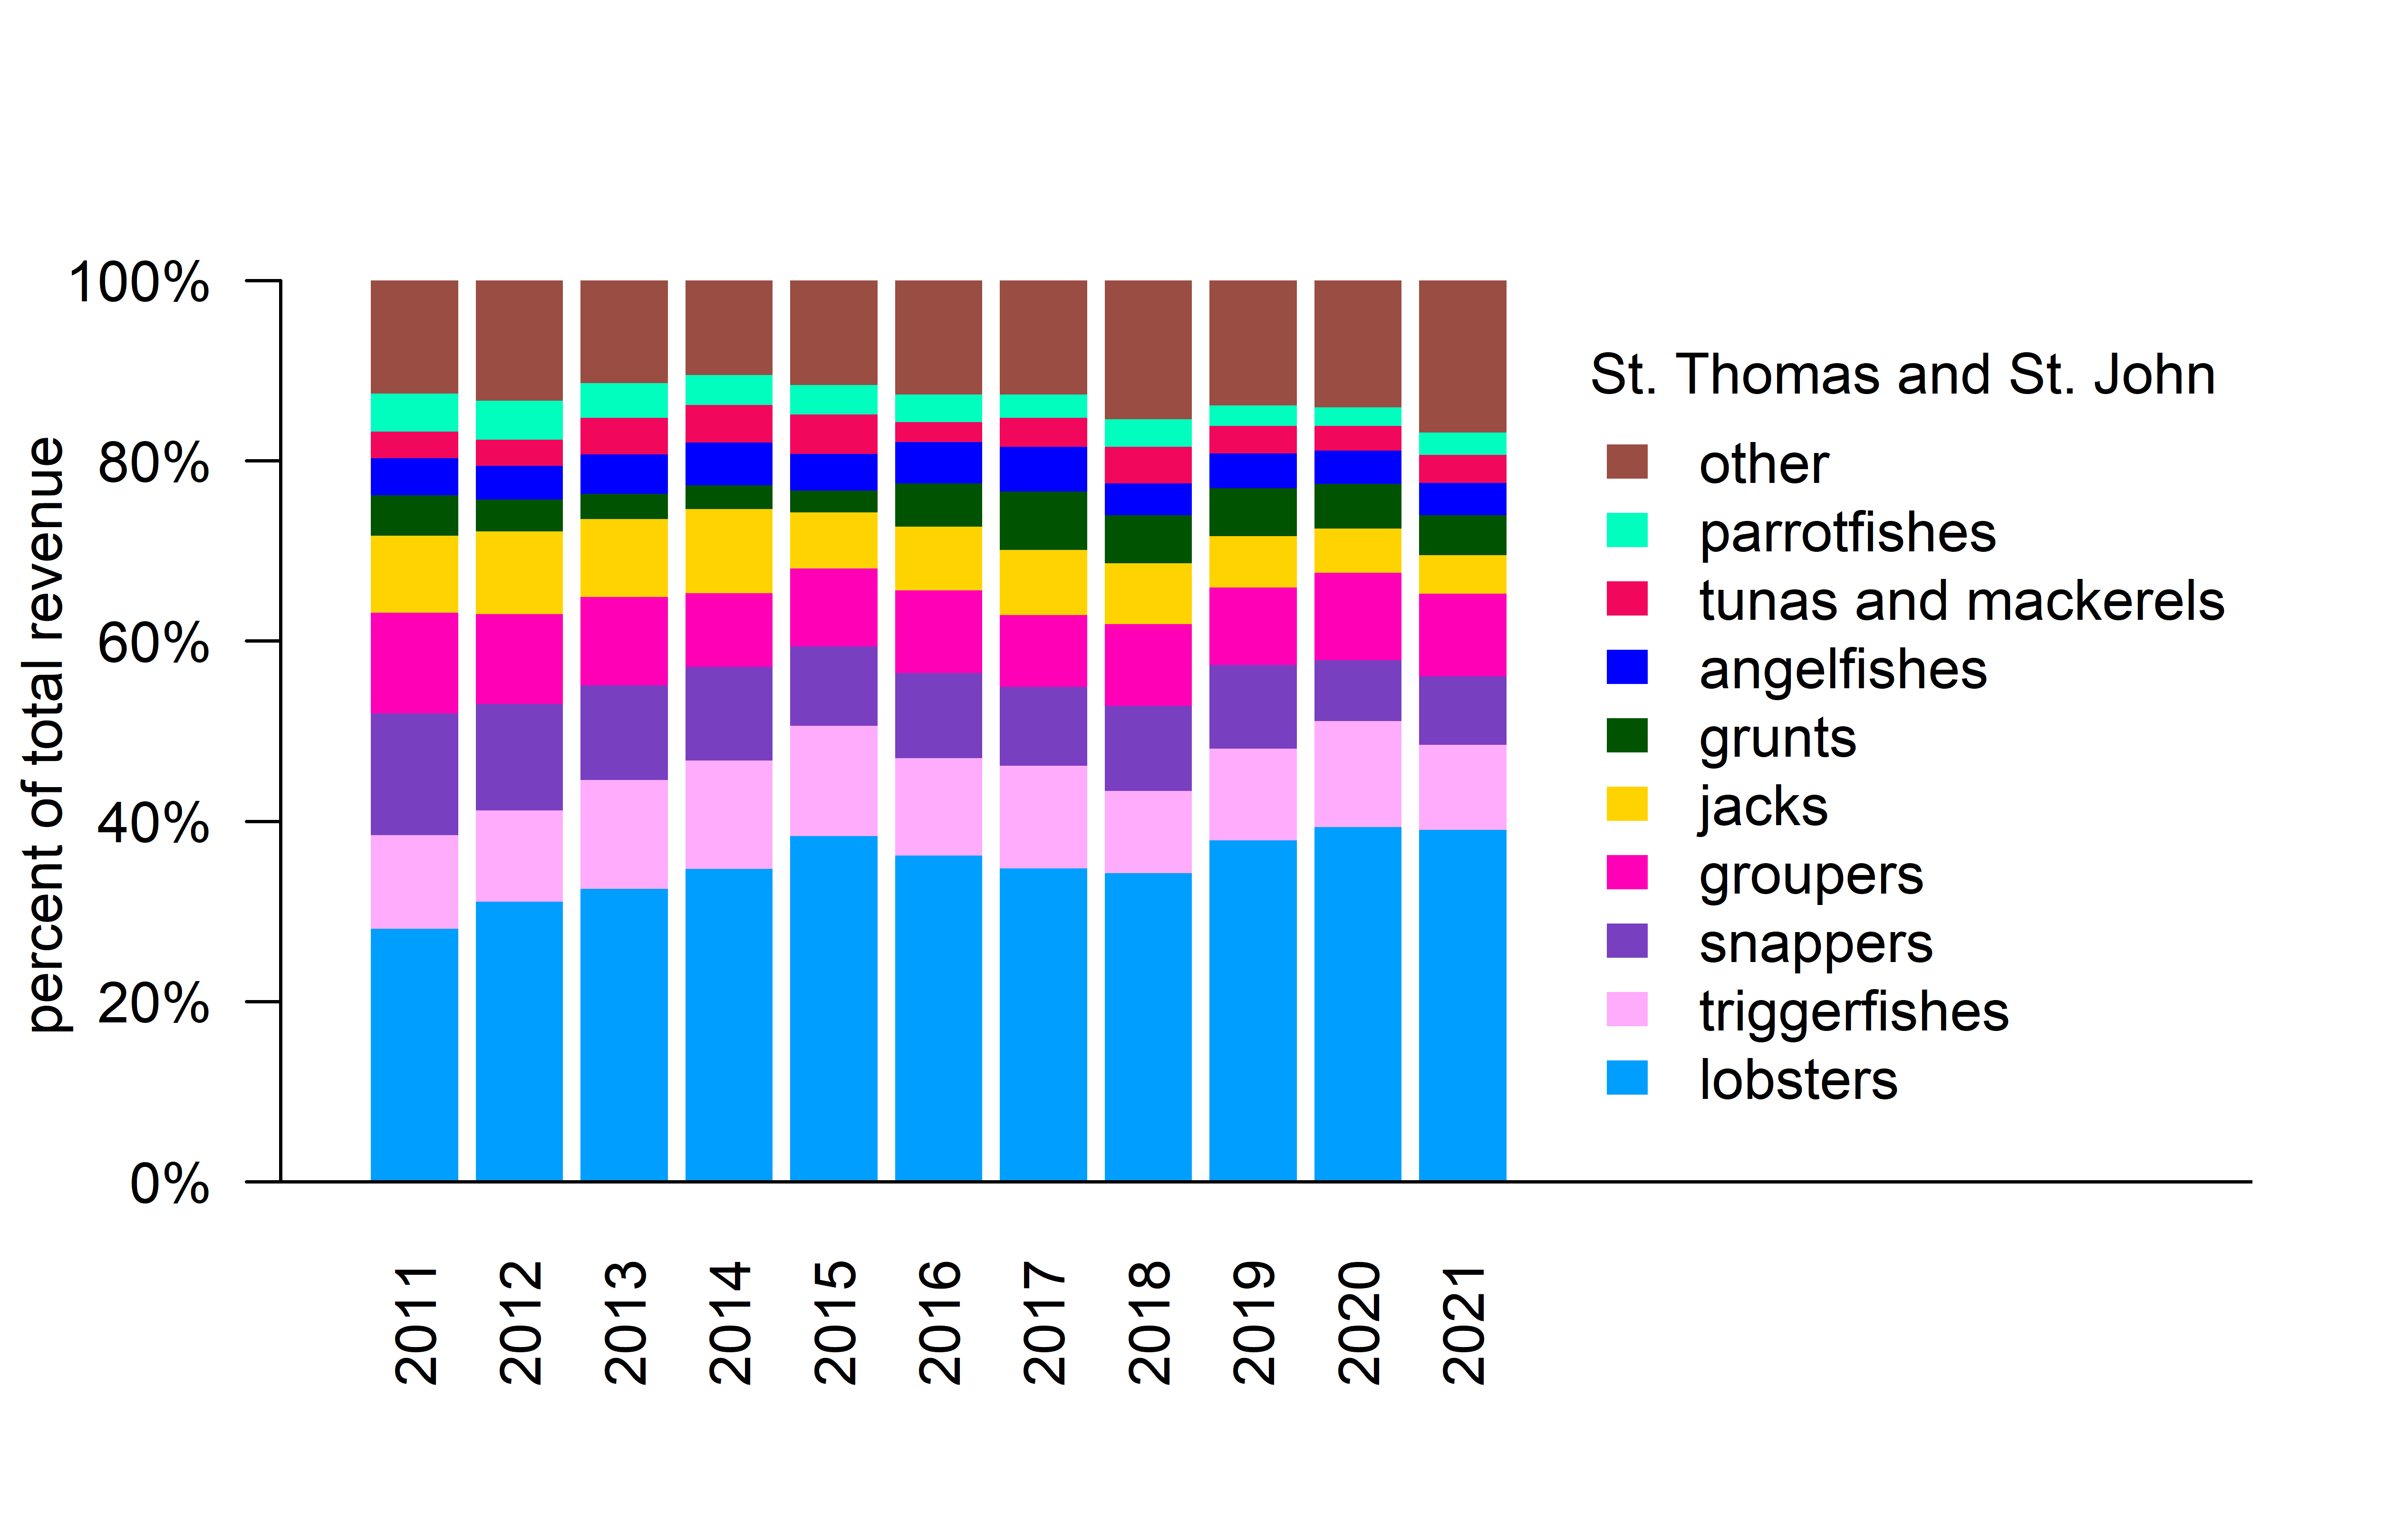
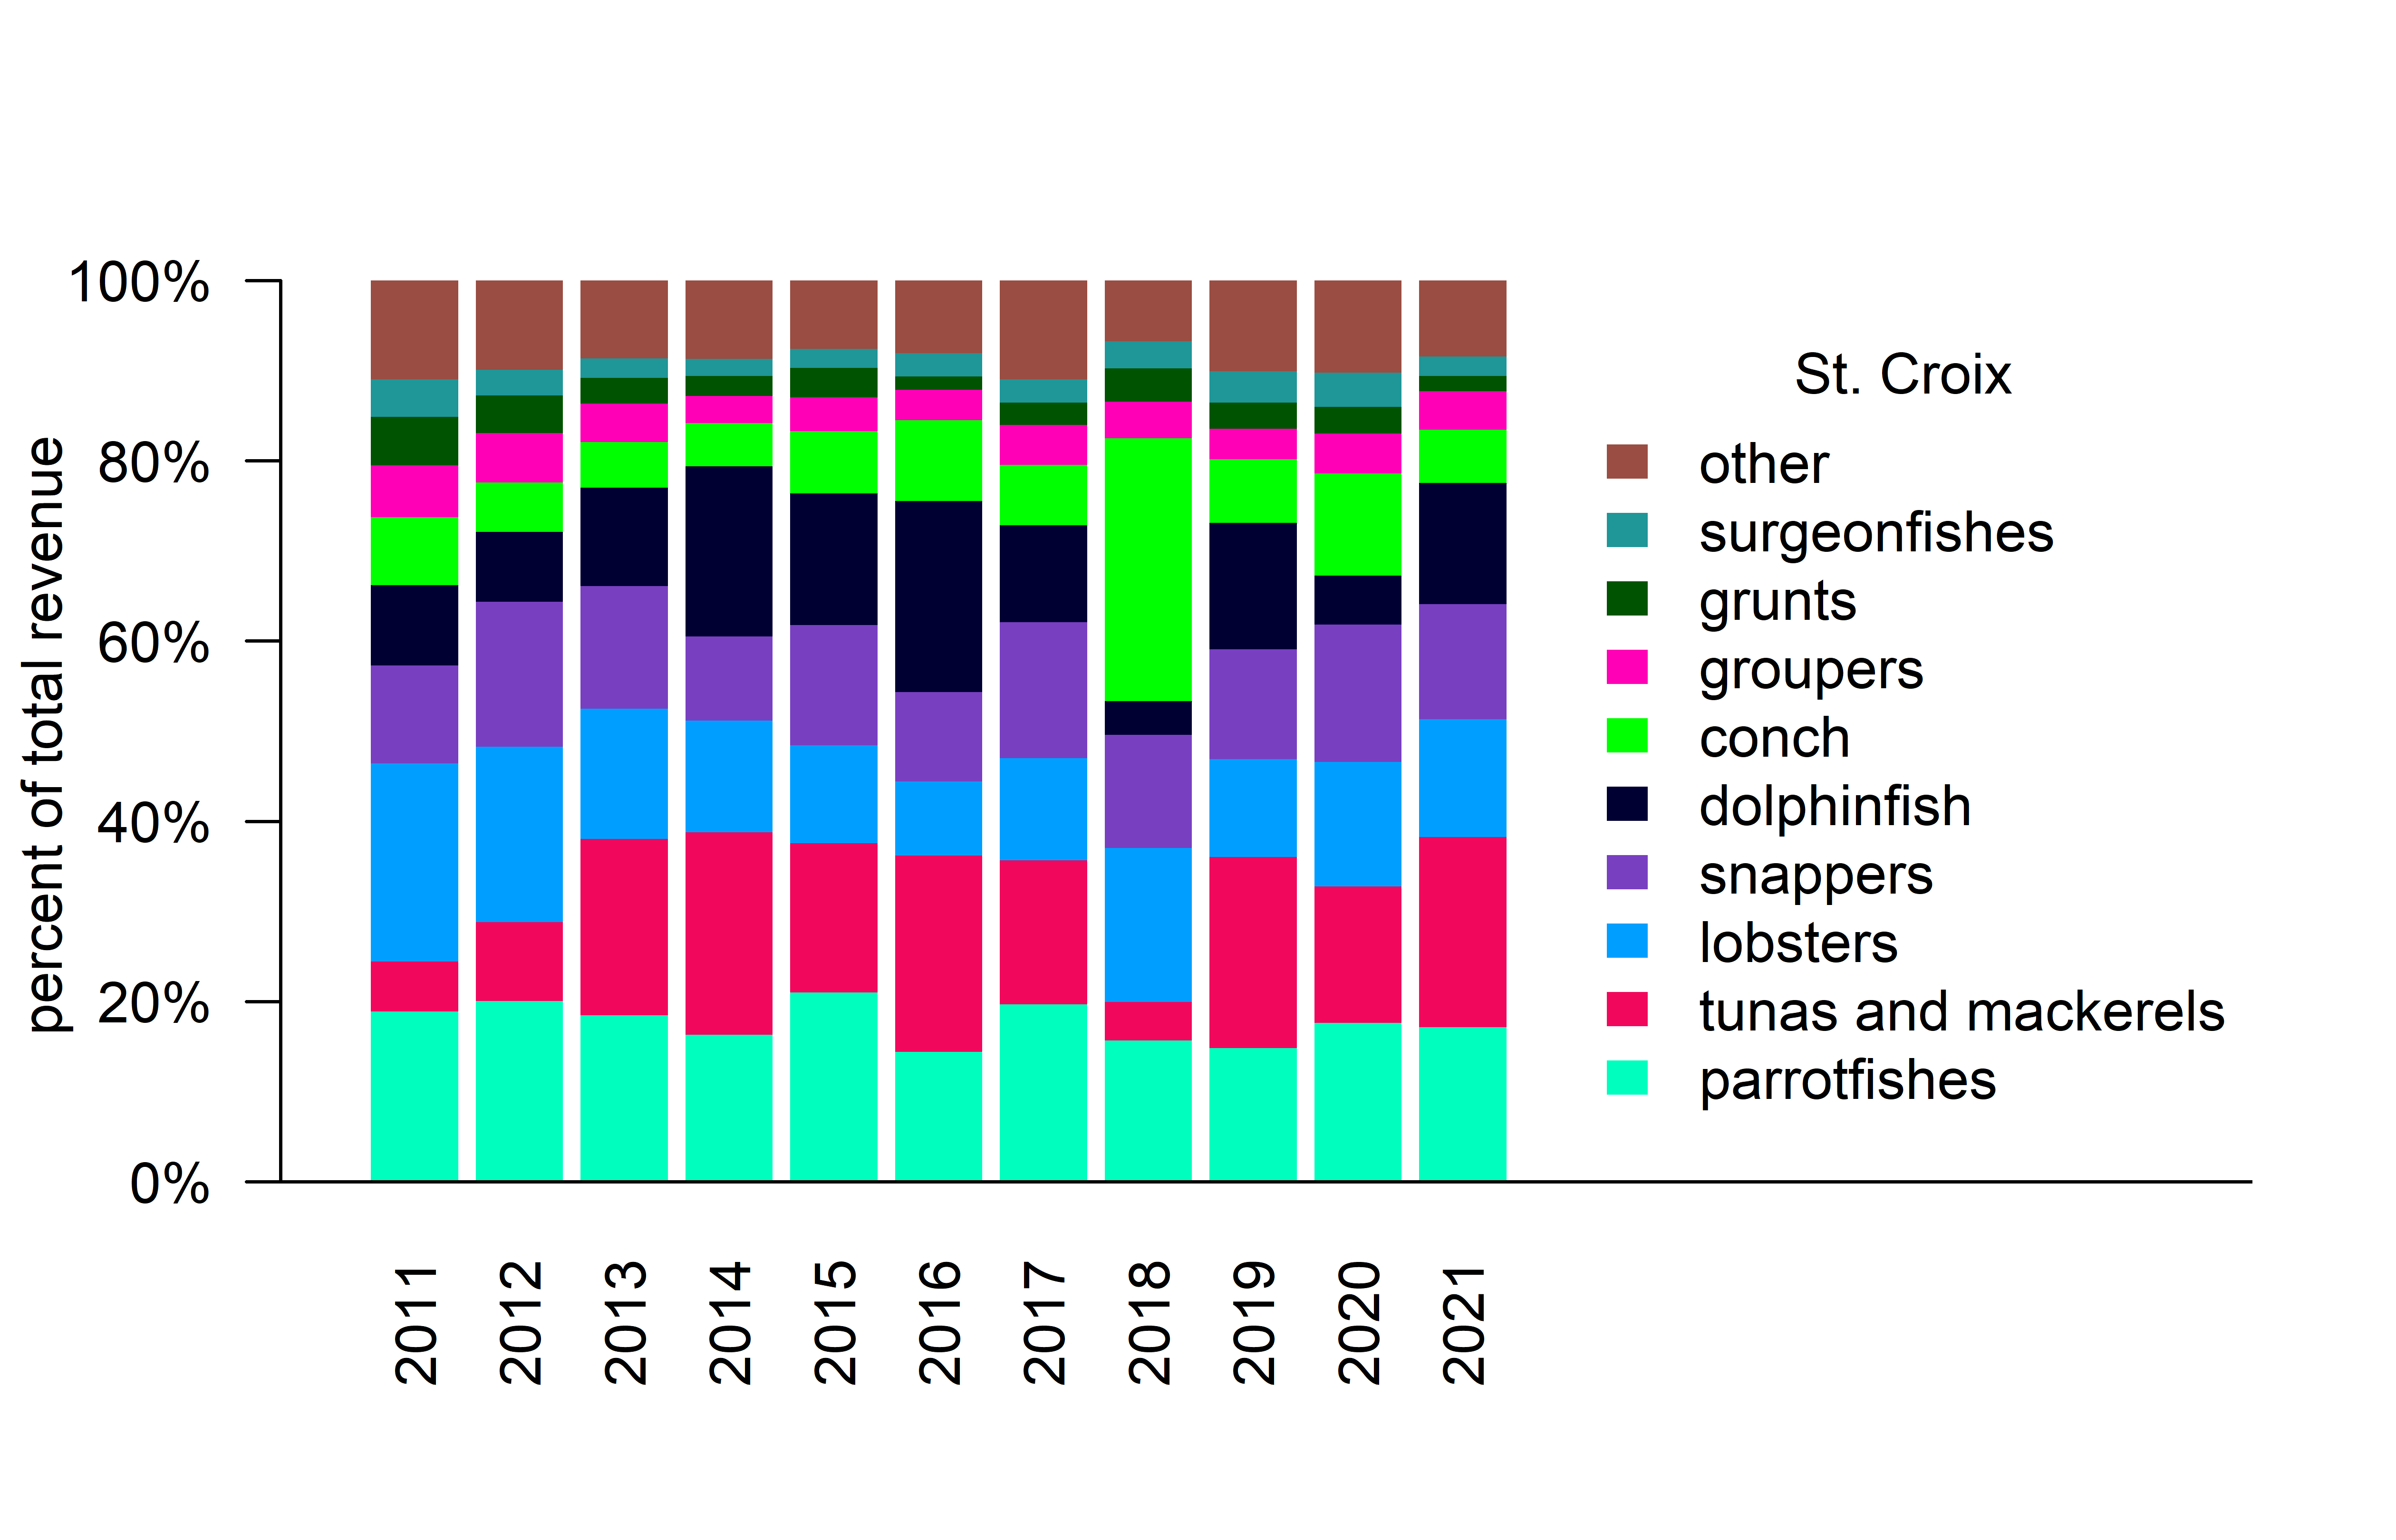
The relative revenue contribution to commercial fisheries by species conveys the changing reliance on different species across the U.S. Caribbean. Revenues were calculated from the Caribbean Commercial Landings data based on the weight of landings in each trip and the reported price; anomalously high prices and missing values were replaced by the overall average price for the given species group. In Puerto Rico, approximately a third of the revenues have consistently come from snapper species; this is followed by lobster and conch, which were both increasing in their revenue contribution up to 2017 (Figure 2.11). In St. Thomas and St. John, there has also been increasing dependence on lobster, which supplies roughly a third of the revenues for those islands (Figure 2.12). Revenues in St. Croix are not dominated by a single species group; parrotfishes, tunas and mackerels, lobsters, snappers, and dolphinfish make up approximately 75% of the revenues (Figure 2.13).

2.2.2 Commercial fishing trips
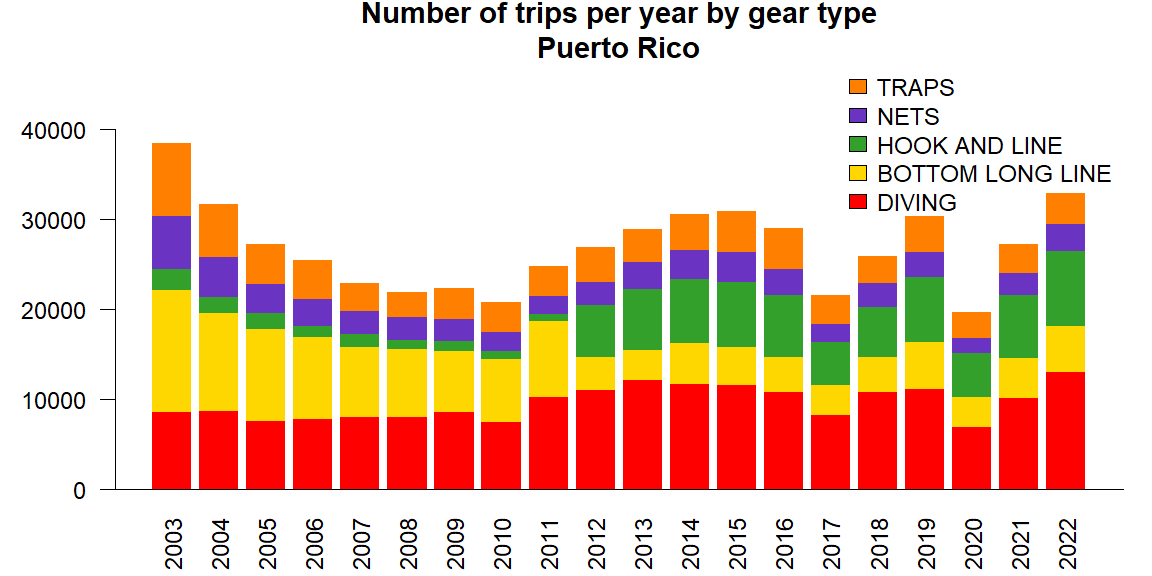
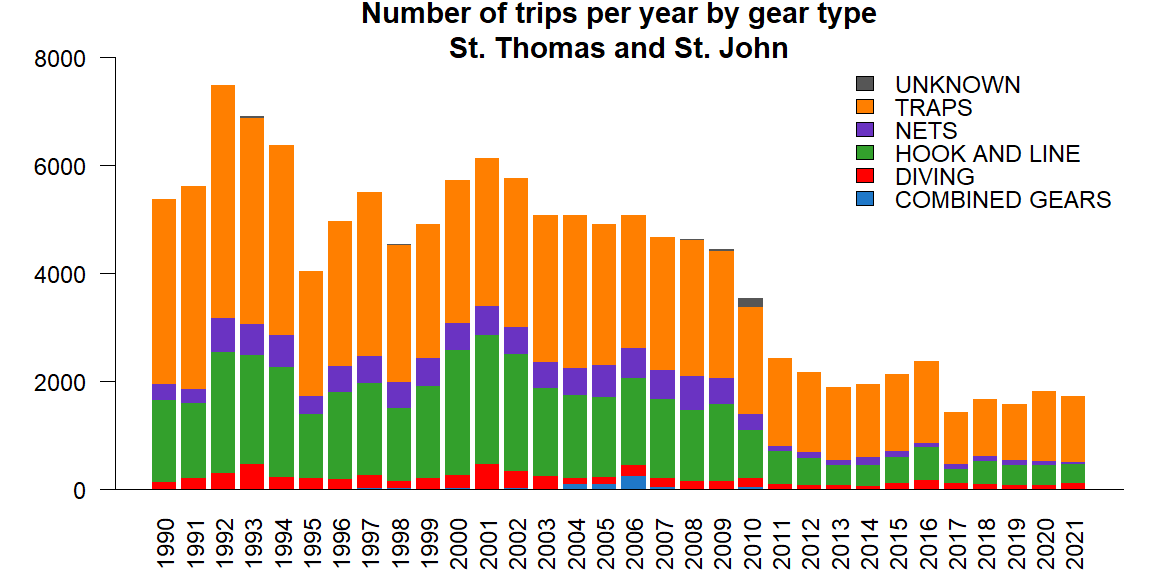
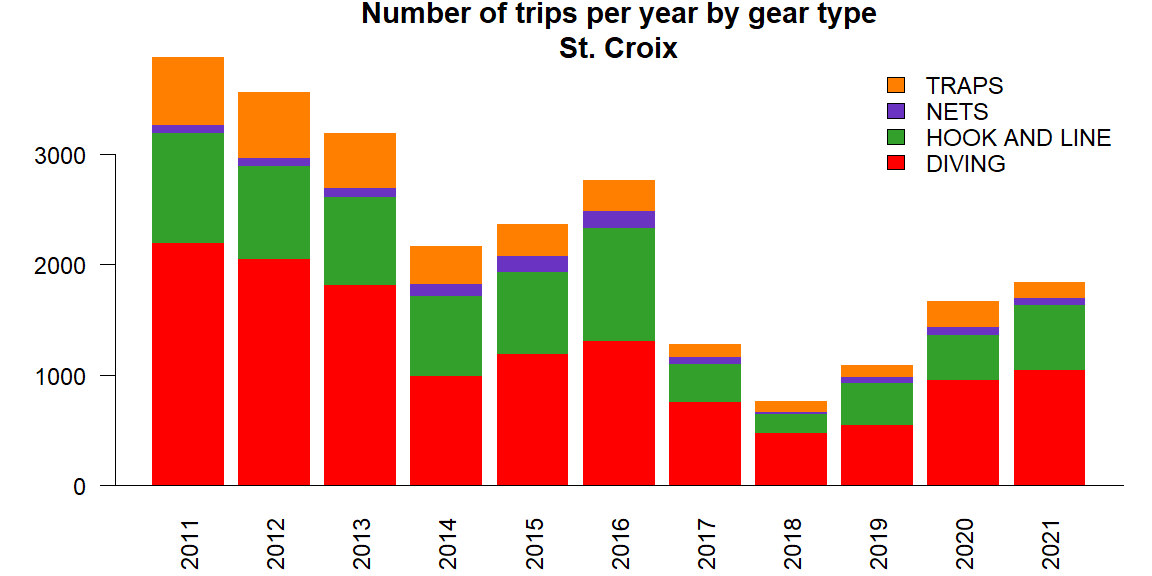
Commercial fishing trips are a useful socioeconomic indicator because they capture the amount and type of effort, which may be driven by market factors, regulations, and costs of entering the fishery. The total number of trips, broken down by gear type, was extracted from the Caribbean Commercial Landings database by identifying unique trips based on date and vessel number and extracting the primary reported gear used for each trip. In Puerto Rico, trip numbers have fluctuated over time, with marked decreases in 2017 and 2020; sudden changes in the hook and line fishing in 2012 are due to changes in reporting forms (Figure 2.14). Effort has declined in St. Thomas and St. John; marked declines after 2010 are likely due to reduced reporting (Figure 2.15). Similarly, in St. Croix the number of trips has declined, with the 2018–2019 fishing season reporting particularly low effort (Figure 2.16). Gear types are plotted using the same color codes, to facilitate comparisons among the islands.
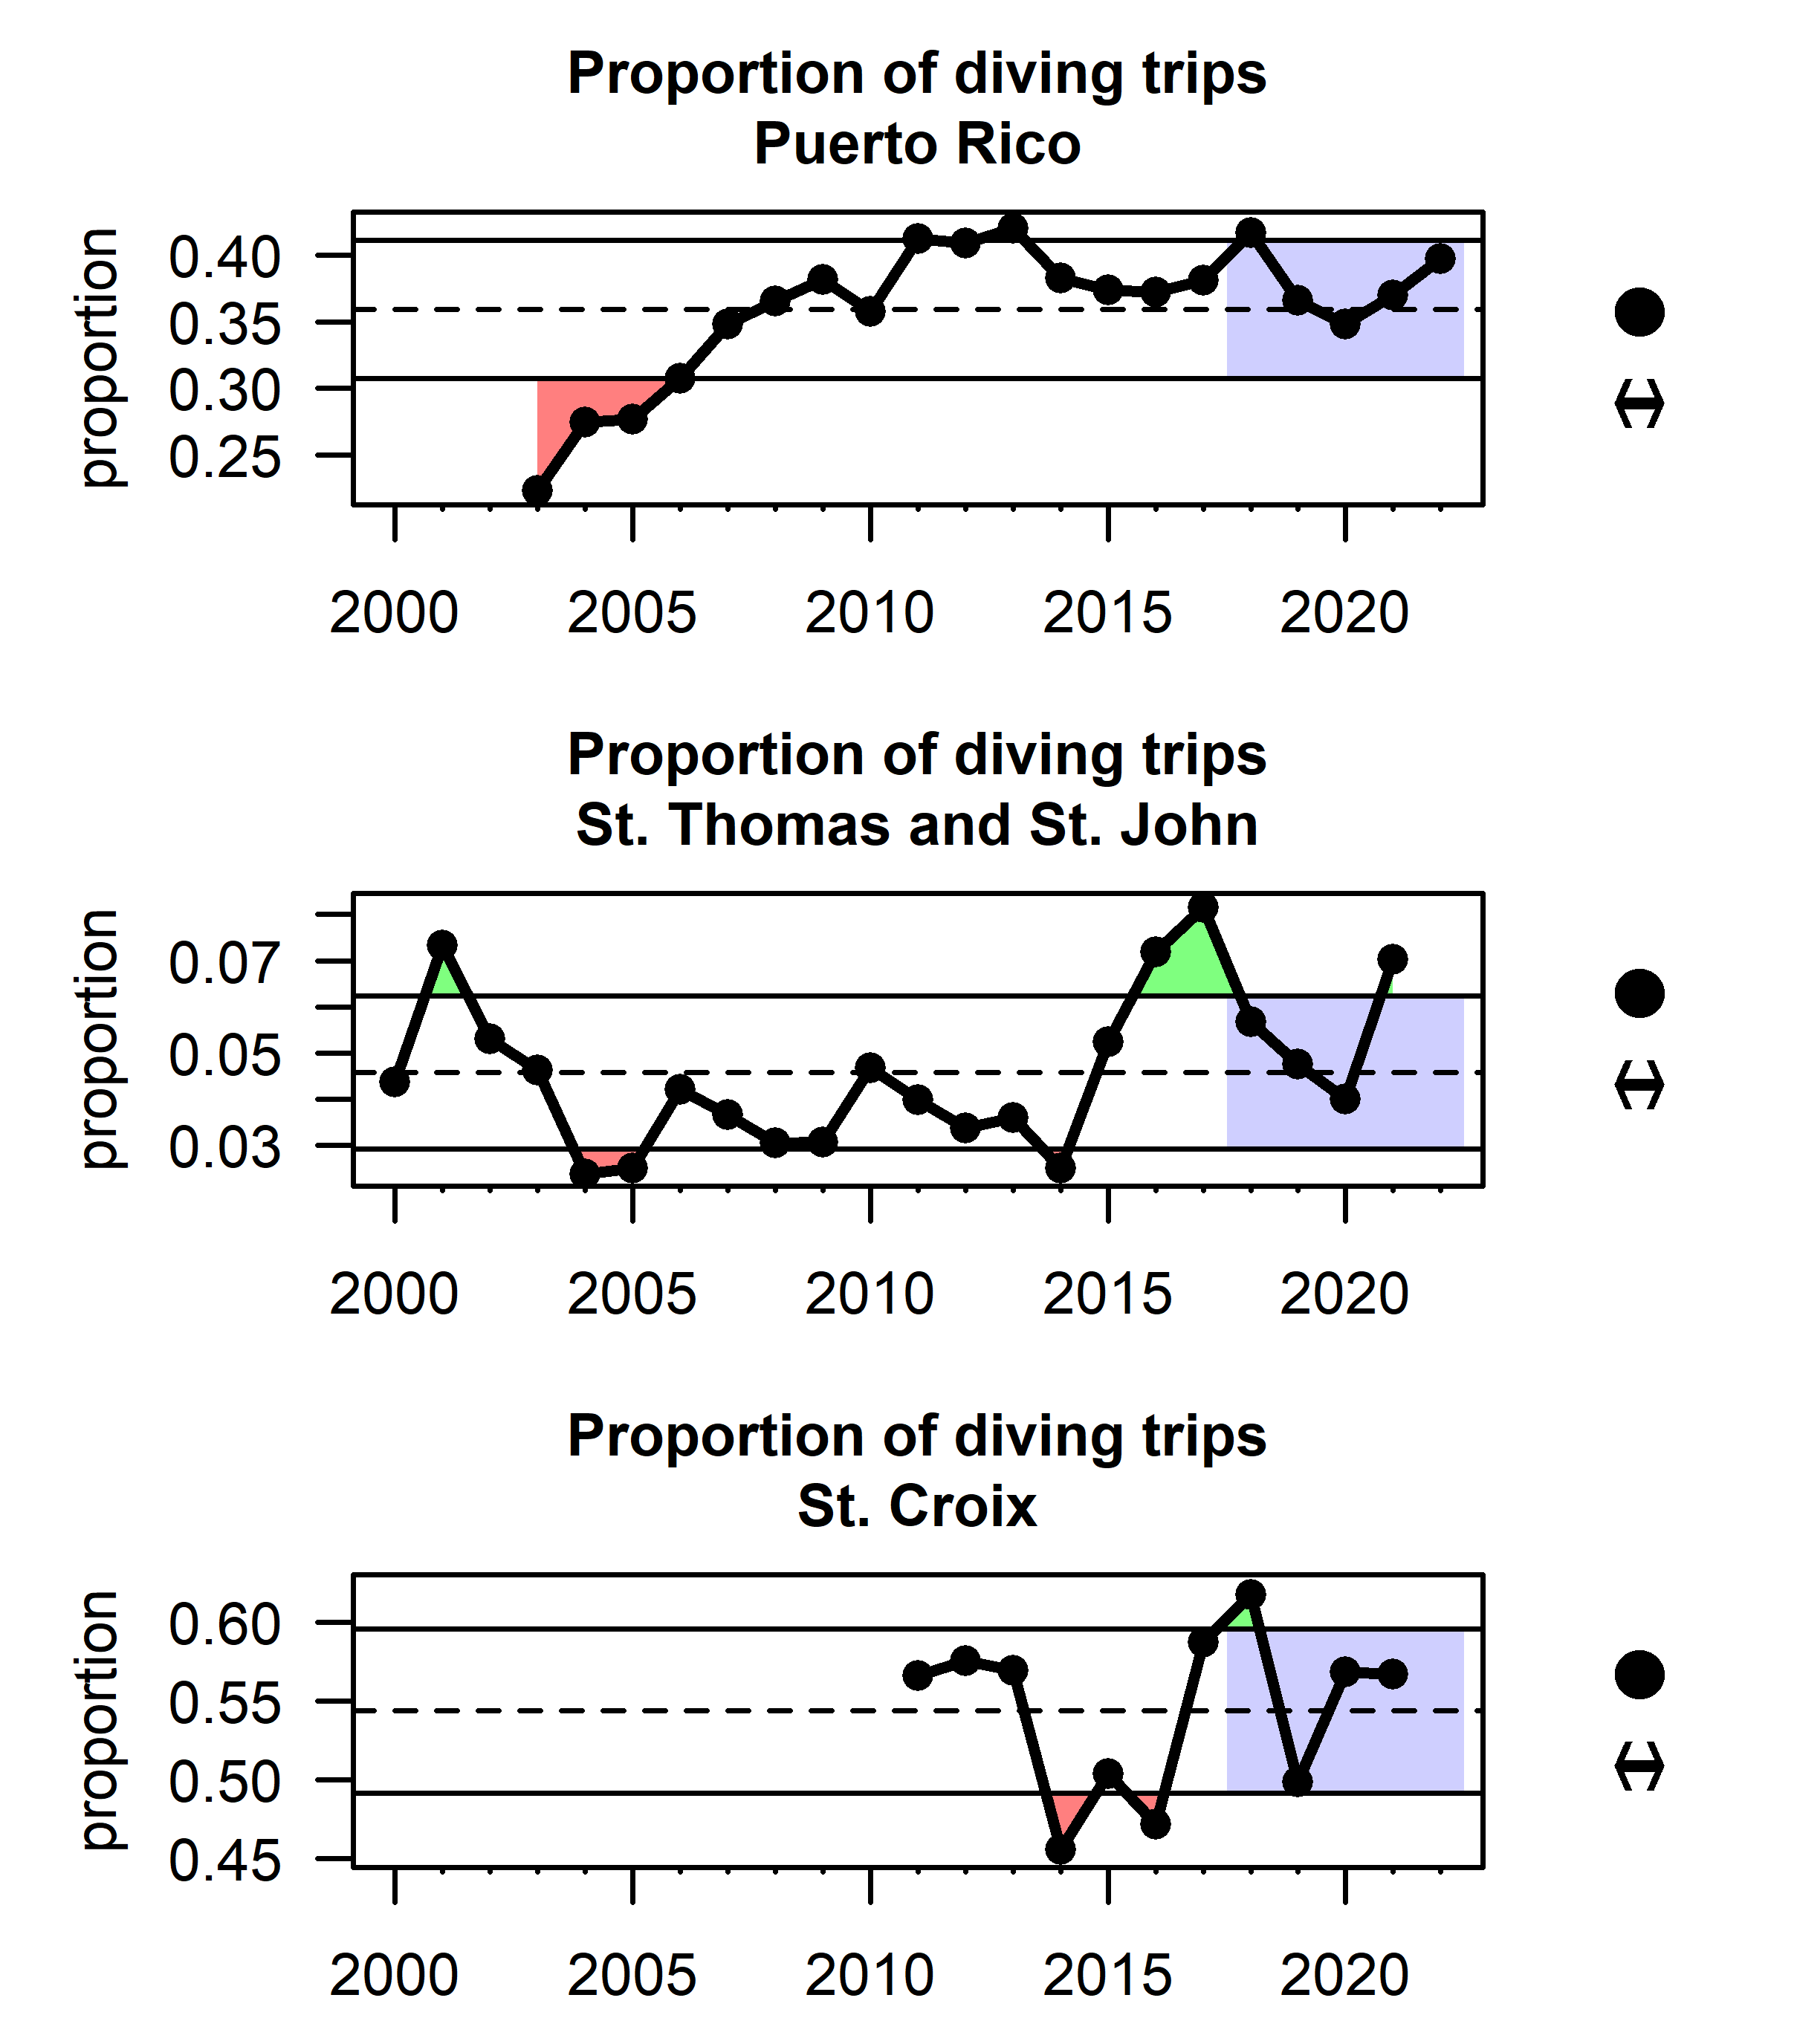
Given the potential for changes in reporting to impact trip numbers, it can more informative to look at the composition of gear types. In particular, diving is often a way of entry for new or part-time fishermen as it generally requires lower up-front investments. Peaks in the proportion diving trips in 2017 and 2018 could be a result of lost traps and infrastructure due to hurricanes (Figure 2.17). In Puerto Rico and St. Croix, the proportion of diving trips has increased in recent years, whereas the proportion has remained stable in St. Thomas and St. John.
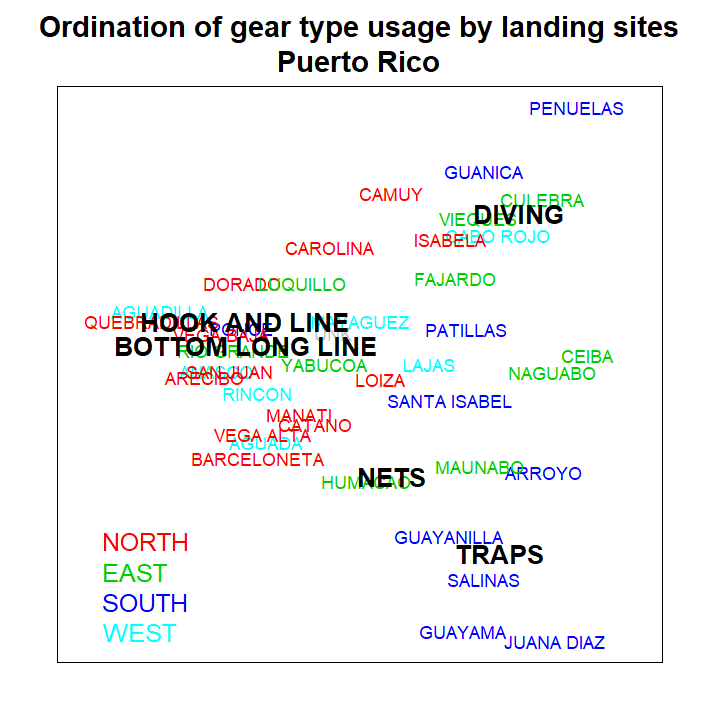
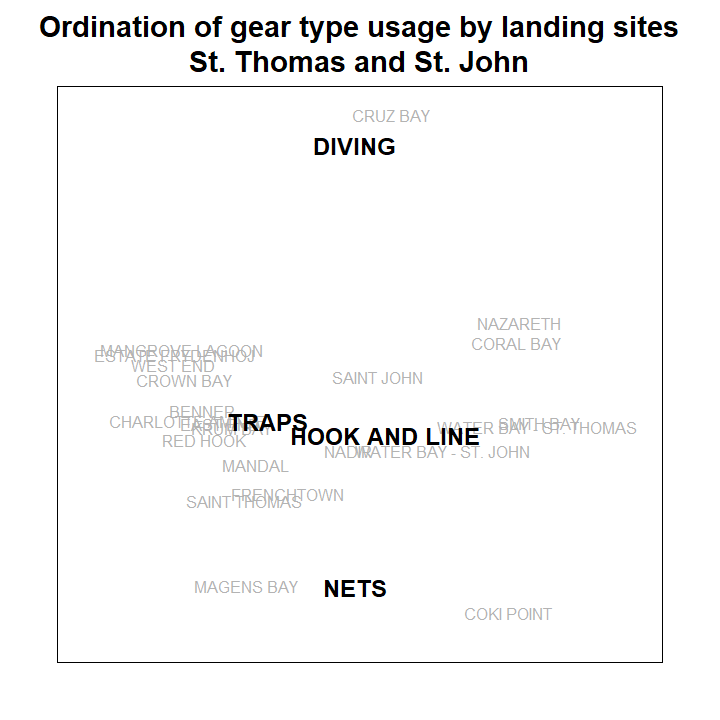
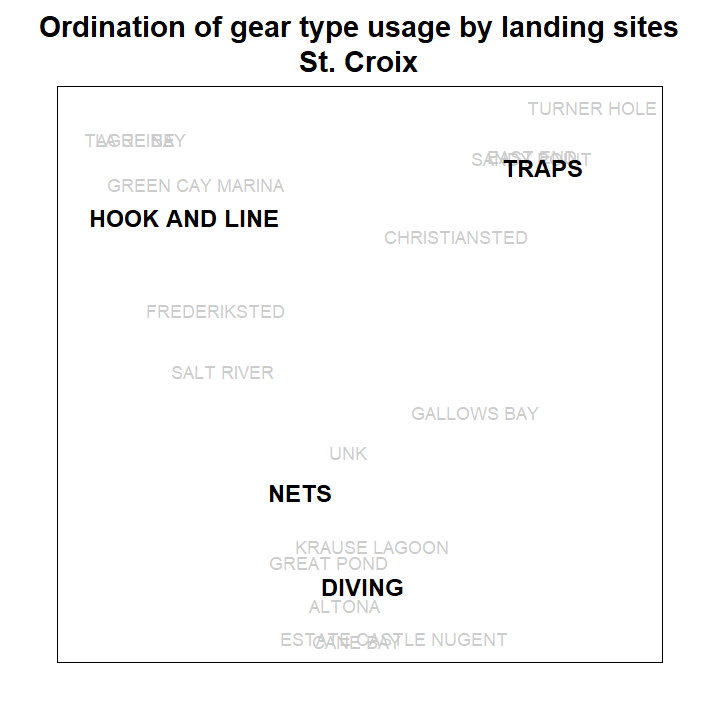
Ordination of gear types based on reporting landing sites conveys how different regions across the U.S. Caribbean depend on different methods of fishing. Ordinations were conducting using non-metric multidimensional scaling (NMDS) based on matrices representing the proportion of gear types used by landing site. The NMDS algorithm seeks to place different sites in an X-dimensional space, such that the physical distances between each pair of sites best represents the differences in gear types employed. Thus, sites that appear more closely together in the figures are more similar in their gear usage, and the position of the gear type labels denote the relative importance of those gear types in those sites. In Puerto Rico for example, hook and line and bottom long line are closely related and are particularly prevalent in the northern landing sites (in red), whereas nets and traps are more prevalent in the South (blue) (Figure 2.18). In St. Thomas and St. John, there is less differentiation between the use of gear types across landing sites (Figure 2.19), whereas in St. Croix, there is clearer differentiation between the use of traps, hook and line, and diving across the various landing sites (Figure 2.20).
2.2.3 Economic activity
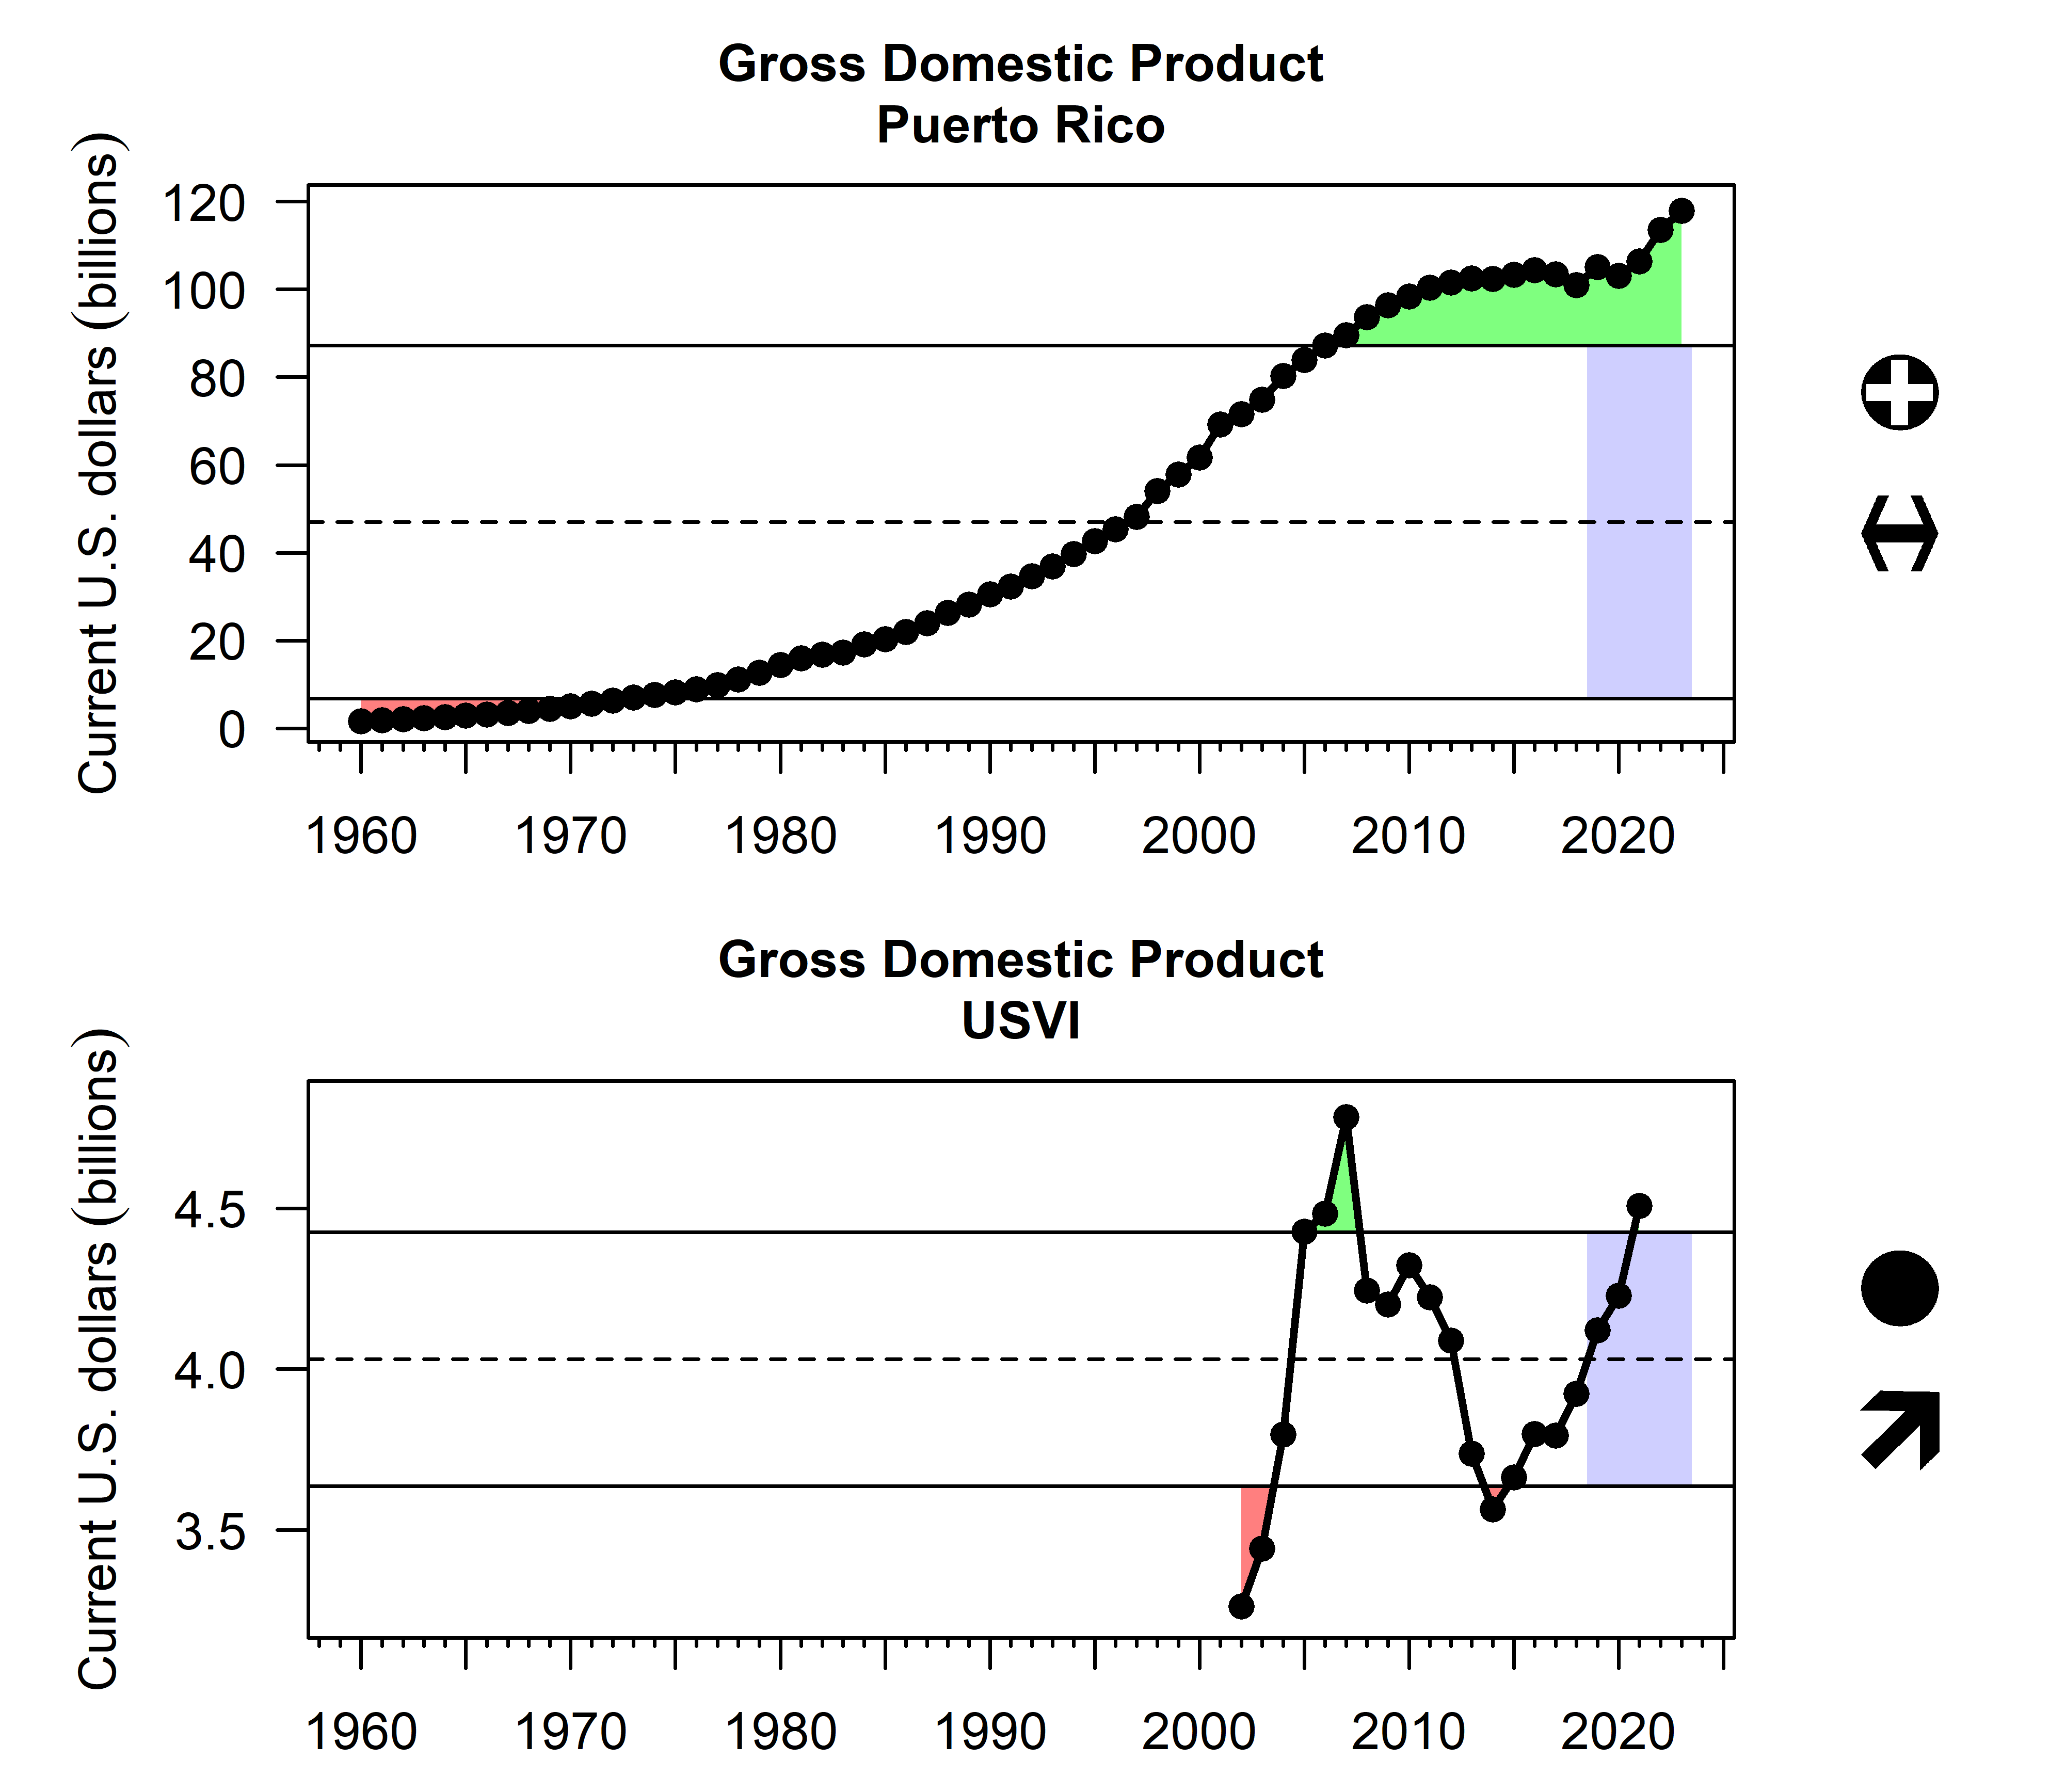
Some indicators of economic activity come in the form of gross domestic product (GDP) and employment trends. GDP data come from the World Bank, and indicate an overall general economic expansion in Puerto Rico (World Bank 2024a). GDP in the USVI (World Bank 2024b) declined substantially from 2007–2014, but has been increasing steadily since (Figure 2.21). Several key trends emerge when analyzing GDP in the USVI, but the broader economic story is one of dependency on external market forces and vulnerability to external shocks. The impact of major disruptions, both natural and financial, has shaped the territory’s economy. For instance, the destruction caused by Hurricanes Irma and Maria in 2017 introduced significant economic and social challenges. Estimates based on USVI fiscal data indicate that public revenues were cut in half following the storms, severely constraining government capacity. This shock compounded pre-existing fiscal pressures, as USVI public revenues had already been significantly affected by the 2007–2009 Great Recession. Given that tourism serves as a primary economic driver, the downturn in the aftermath of these events further limited growth in the region.
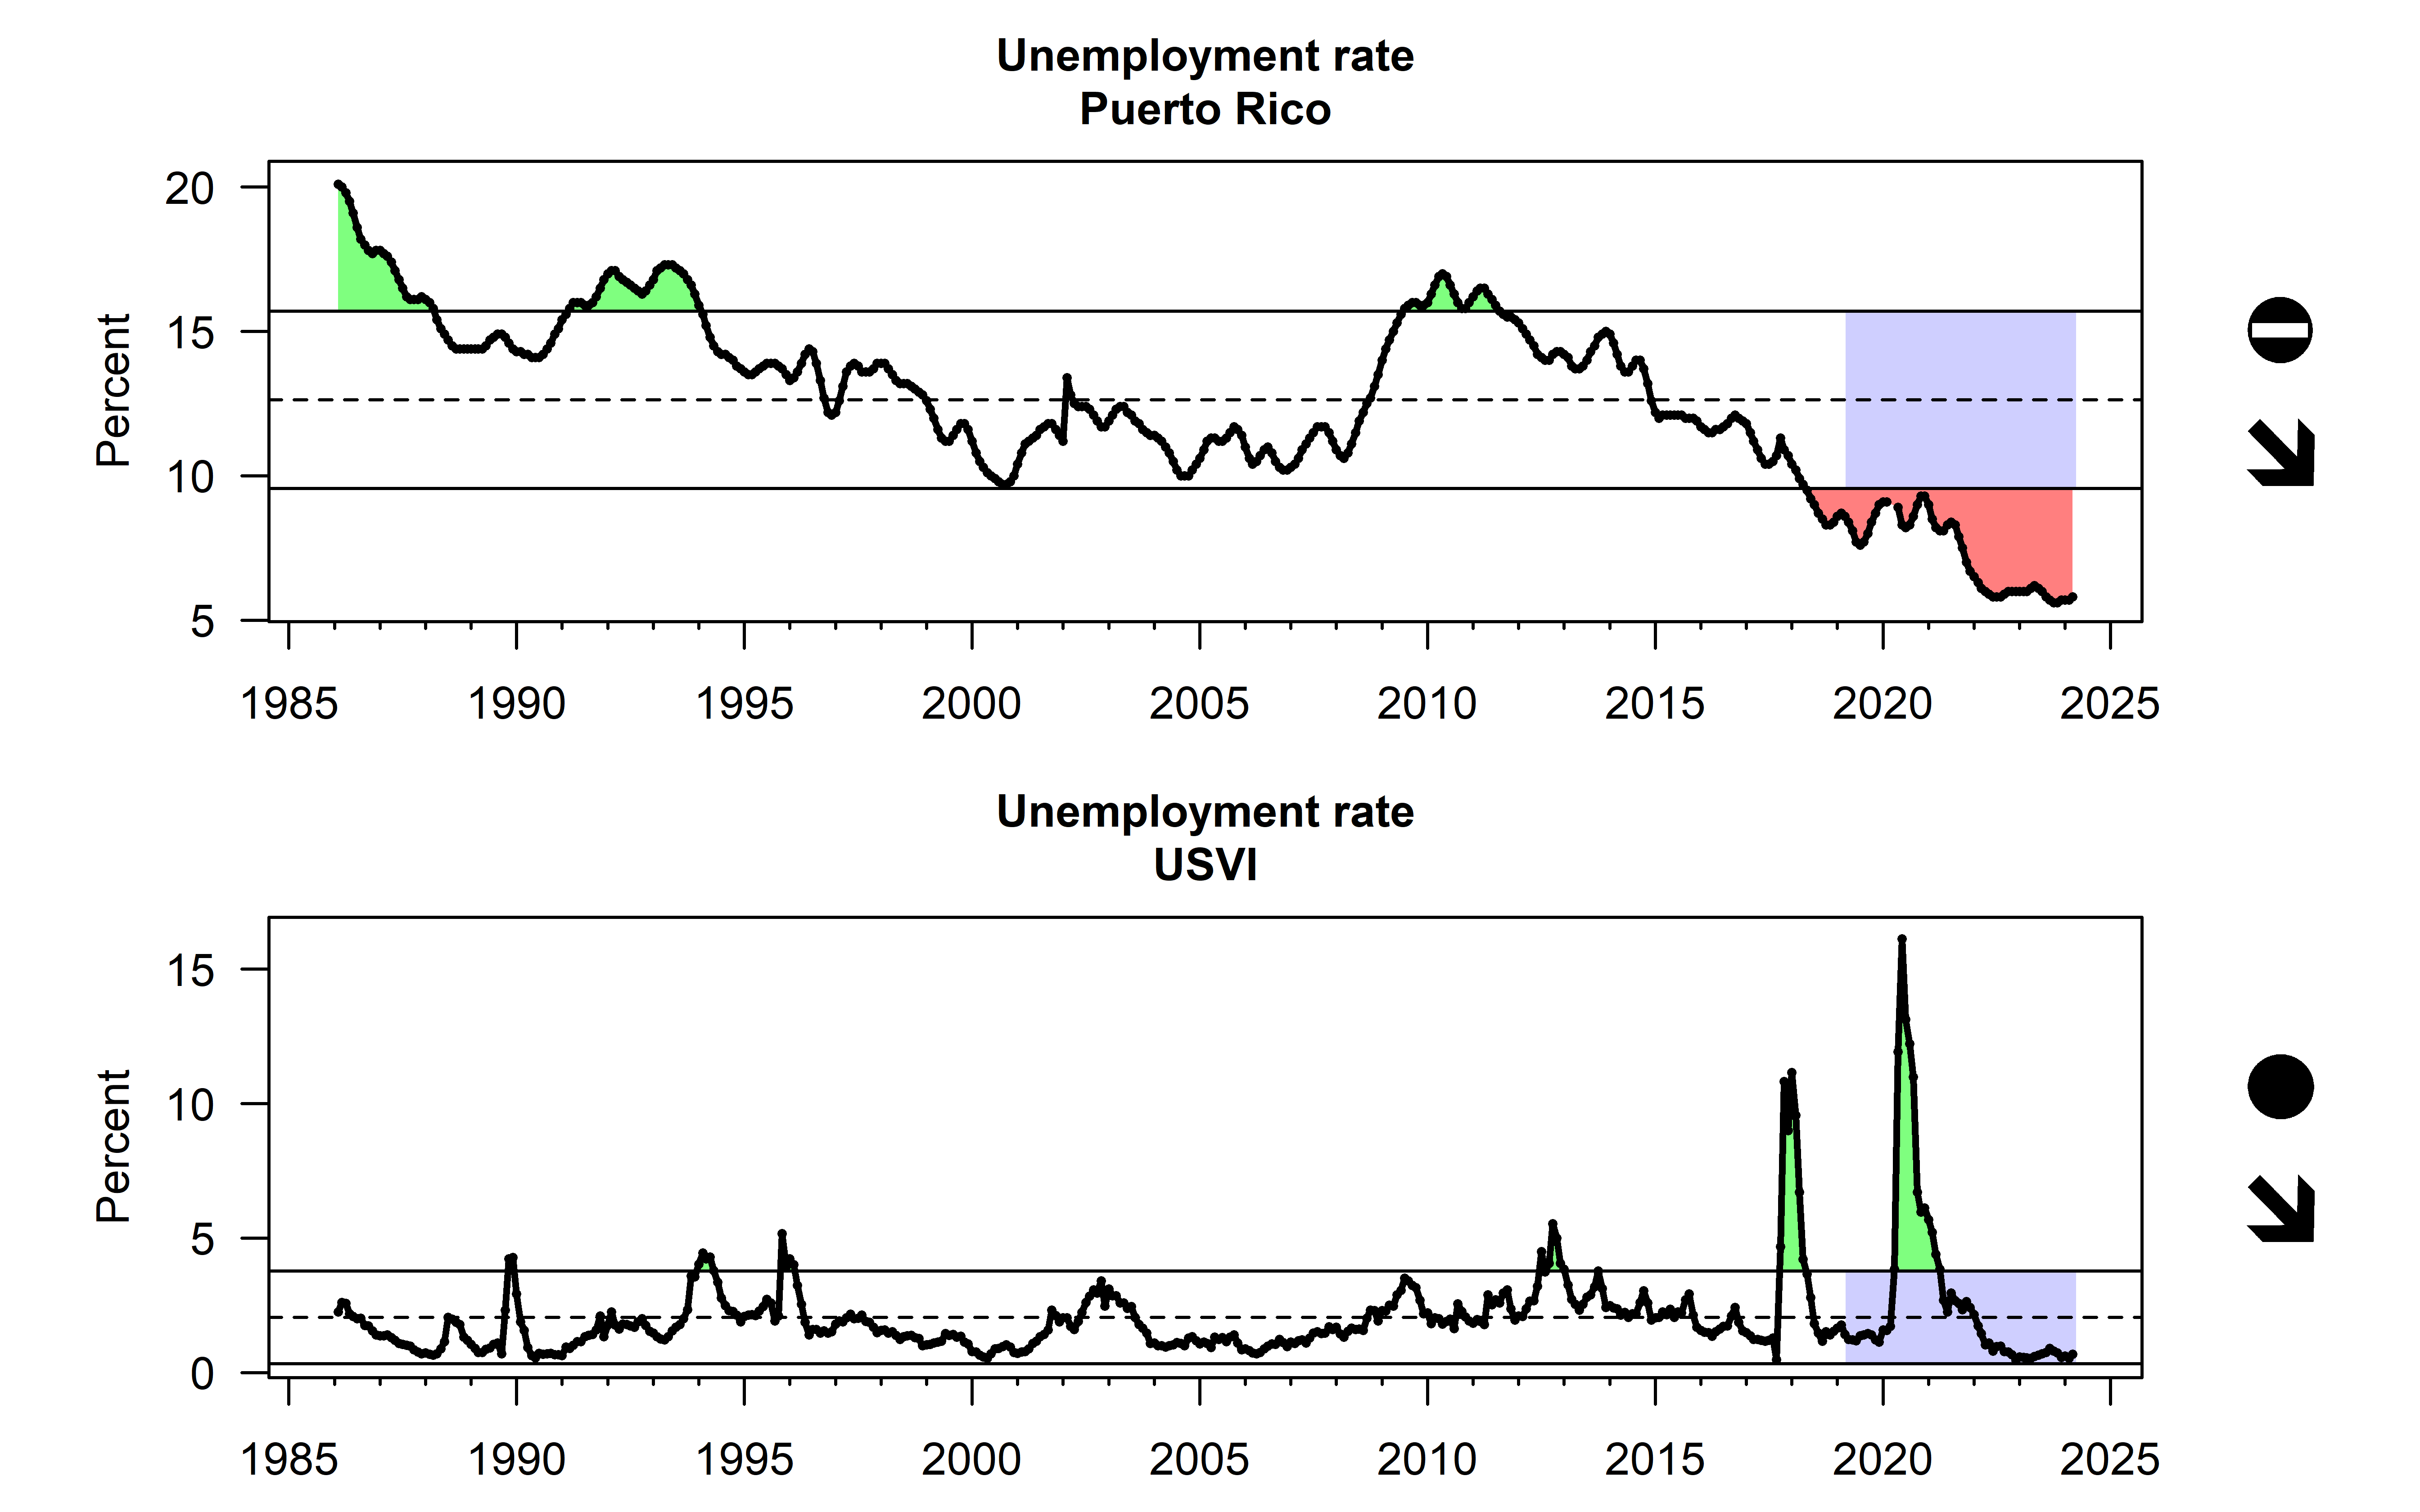
GDP can sometimes underestimate the ocean-dependency of the regions’ local island economies; another indicator that is useful is employment/unemployment rate data, which come from the U.S. Bureau of Labor Statistics (U. S. Bureau of Labor Statistics 2024) and the U.S. Employment and Training Administration (U.S. Employment and Training Administration 2024). Unemployment has shown a declining trend over time in Puerto Rico and the USVI. In the USVI, there were notable spikes in the unemployment rate in 2018 and 2020, following major hurricanes Irma and Maria and the COVID-19 pandemic.
2.2.4 Ocean economy
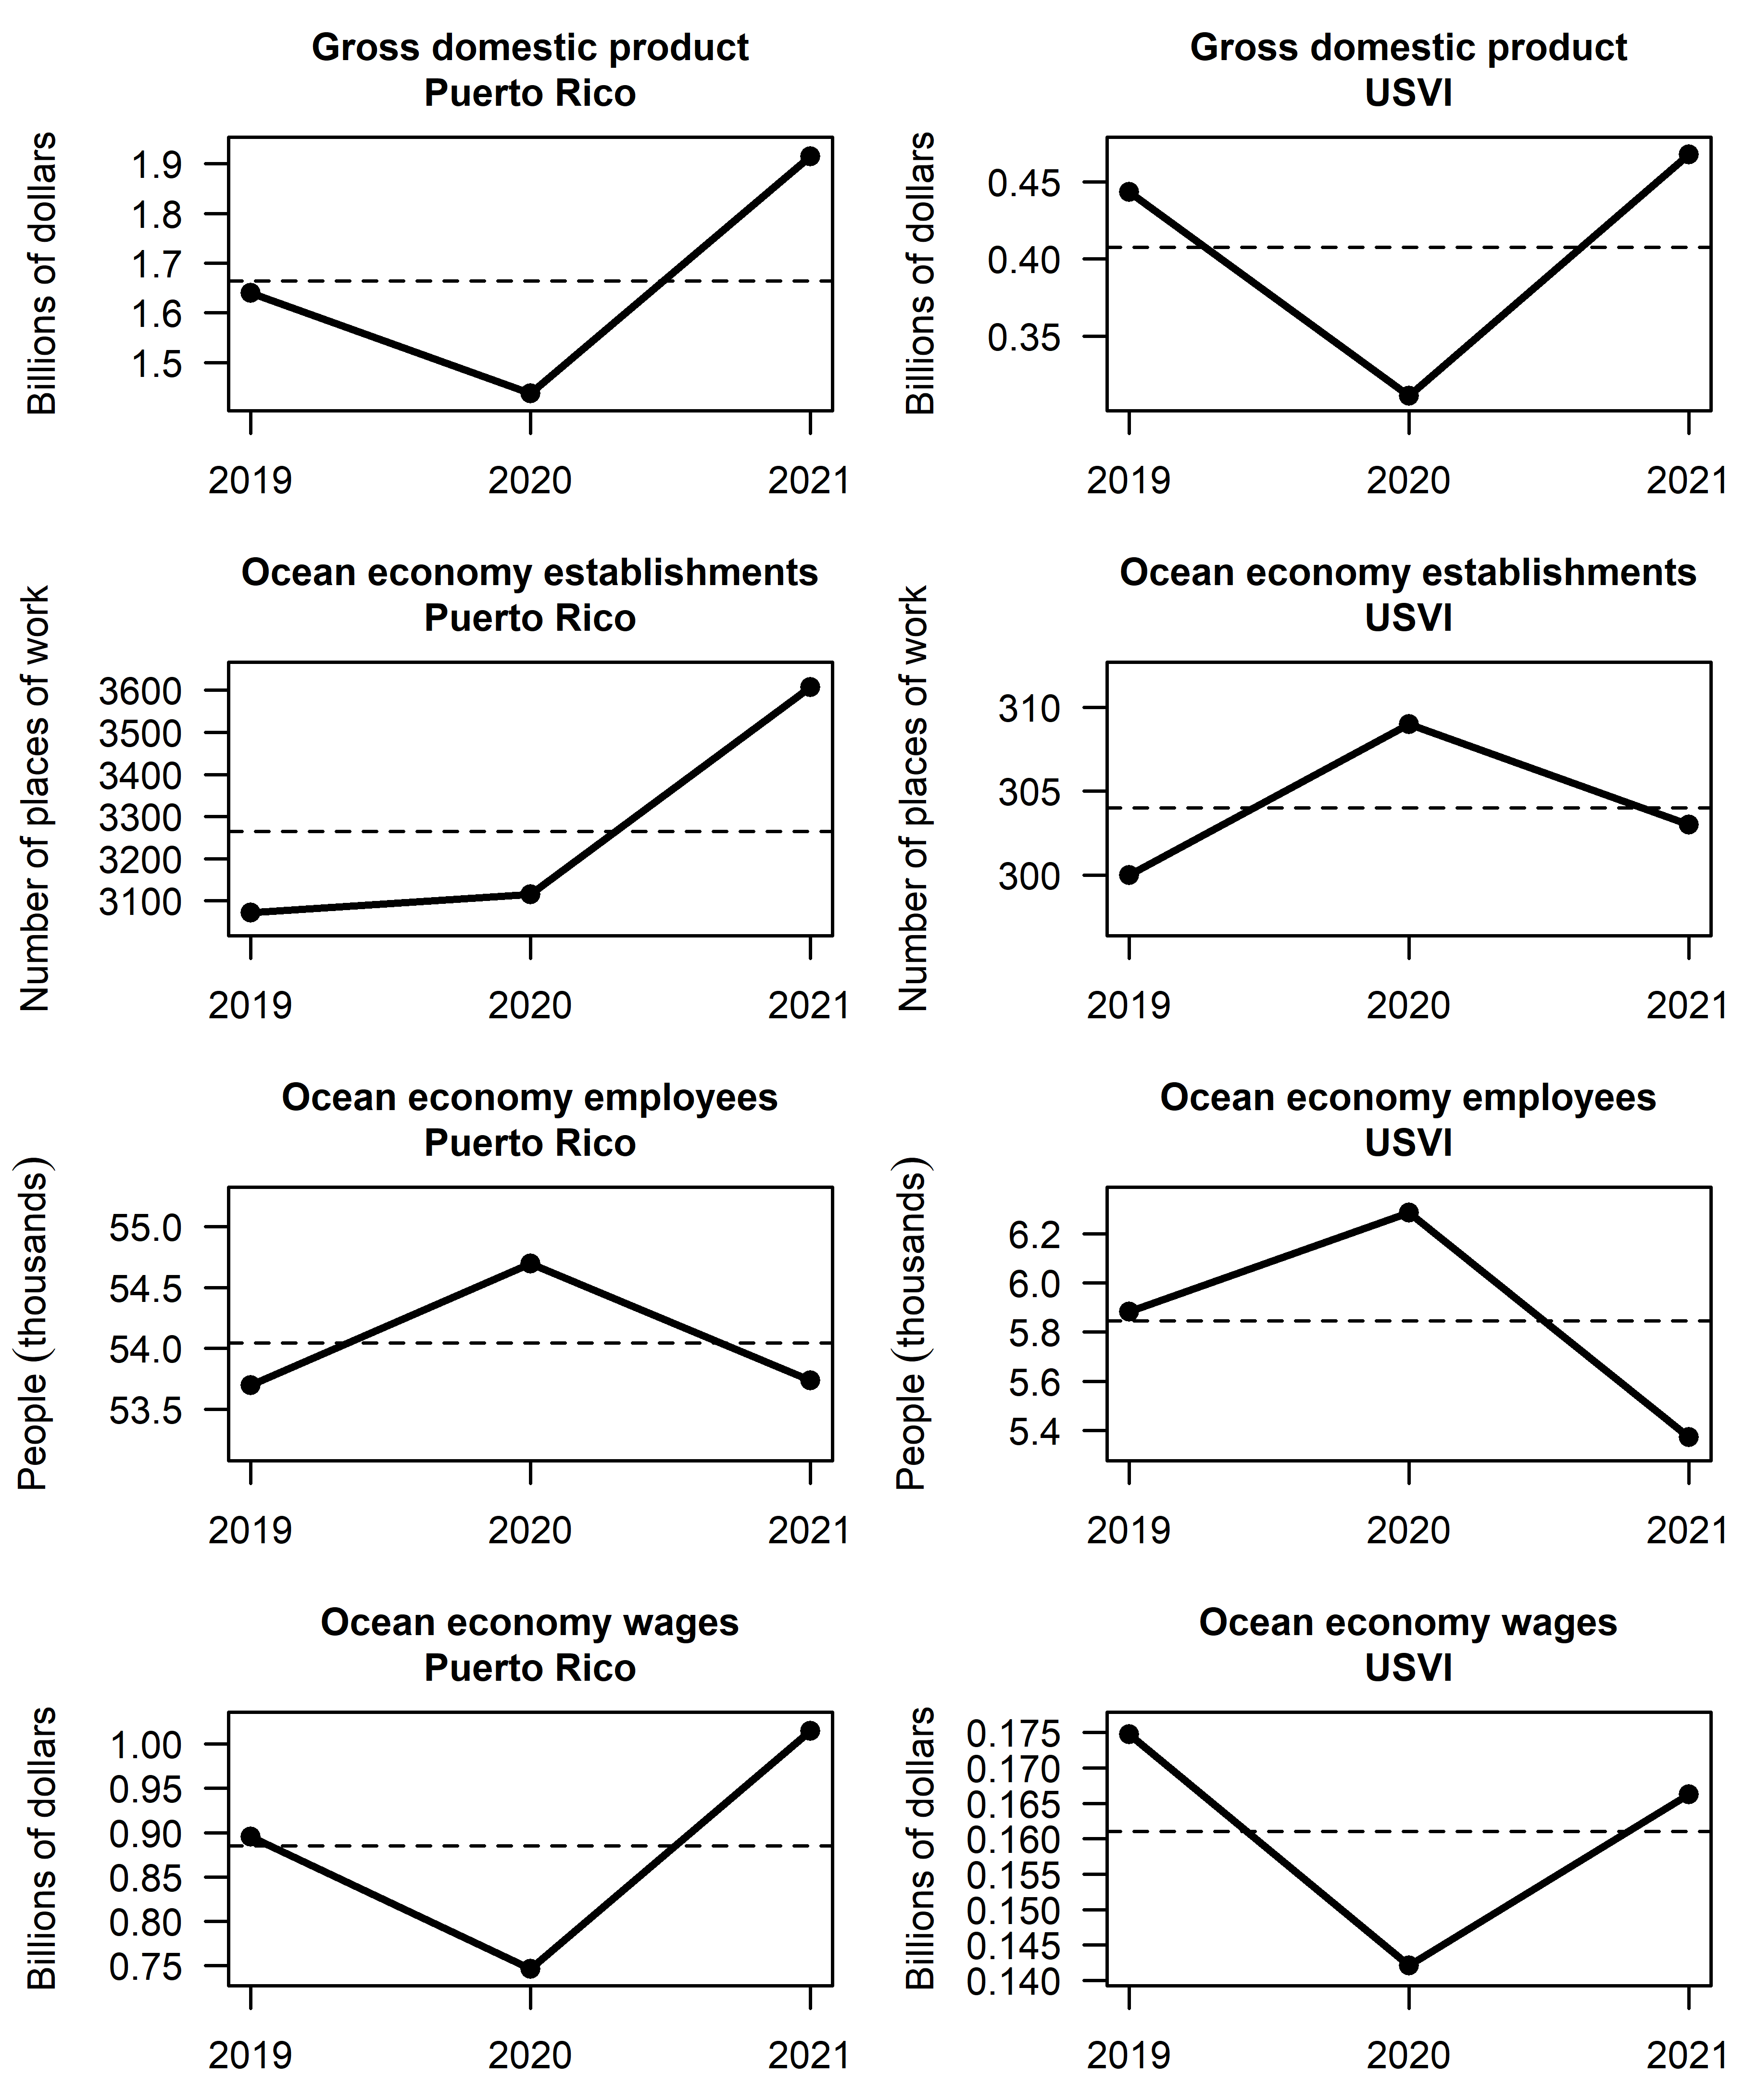
Due to their unique geography, culture and setting, the islands of Puerto Rico and the USVI are more reliant on the surrounding ocean and marine environments than many parts of the continental United States. Data from the Bureau of Labor Statistics Quarterly Census of Employment and Wages (https://www.bls.gov/cew/downloadable-data-files.htm) provide data on the number of establishments, employees, and wages earned for each county by industry (as defined by NAICS code). These data underpin the Economics: National Ocean Watch (ENOW) methods created by NOAA’s Office for Coastal Management to track contributions of the ocean economy to the overall economy. There were significant changes to the way ocean economy metrics were calculated for the U.S. Territories in 2016 (Clements, Feliciano, and Colgan 2016), and revised metric data are only available from 2019-2021 through ENOW. It is therefore difficult to assess trends over time until additional data are collected (Figure 2.23).
2.3 Equality
2.3.1 Commercial revenue distribution
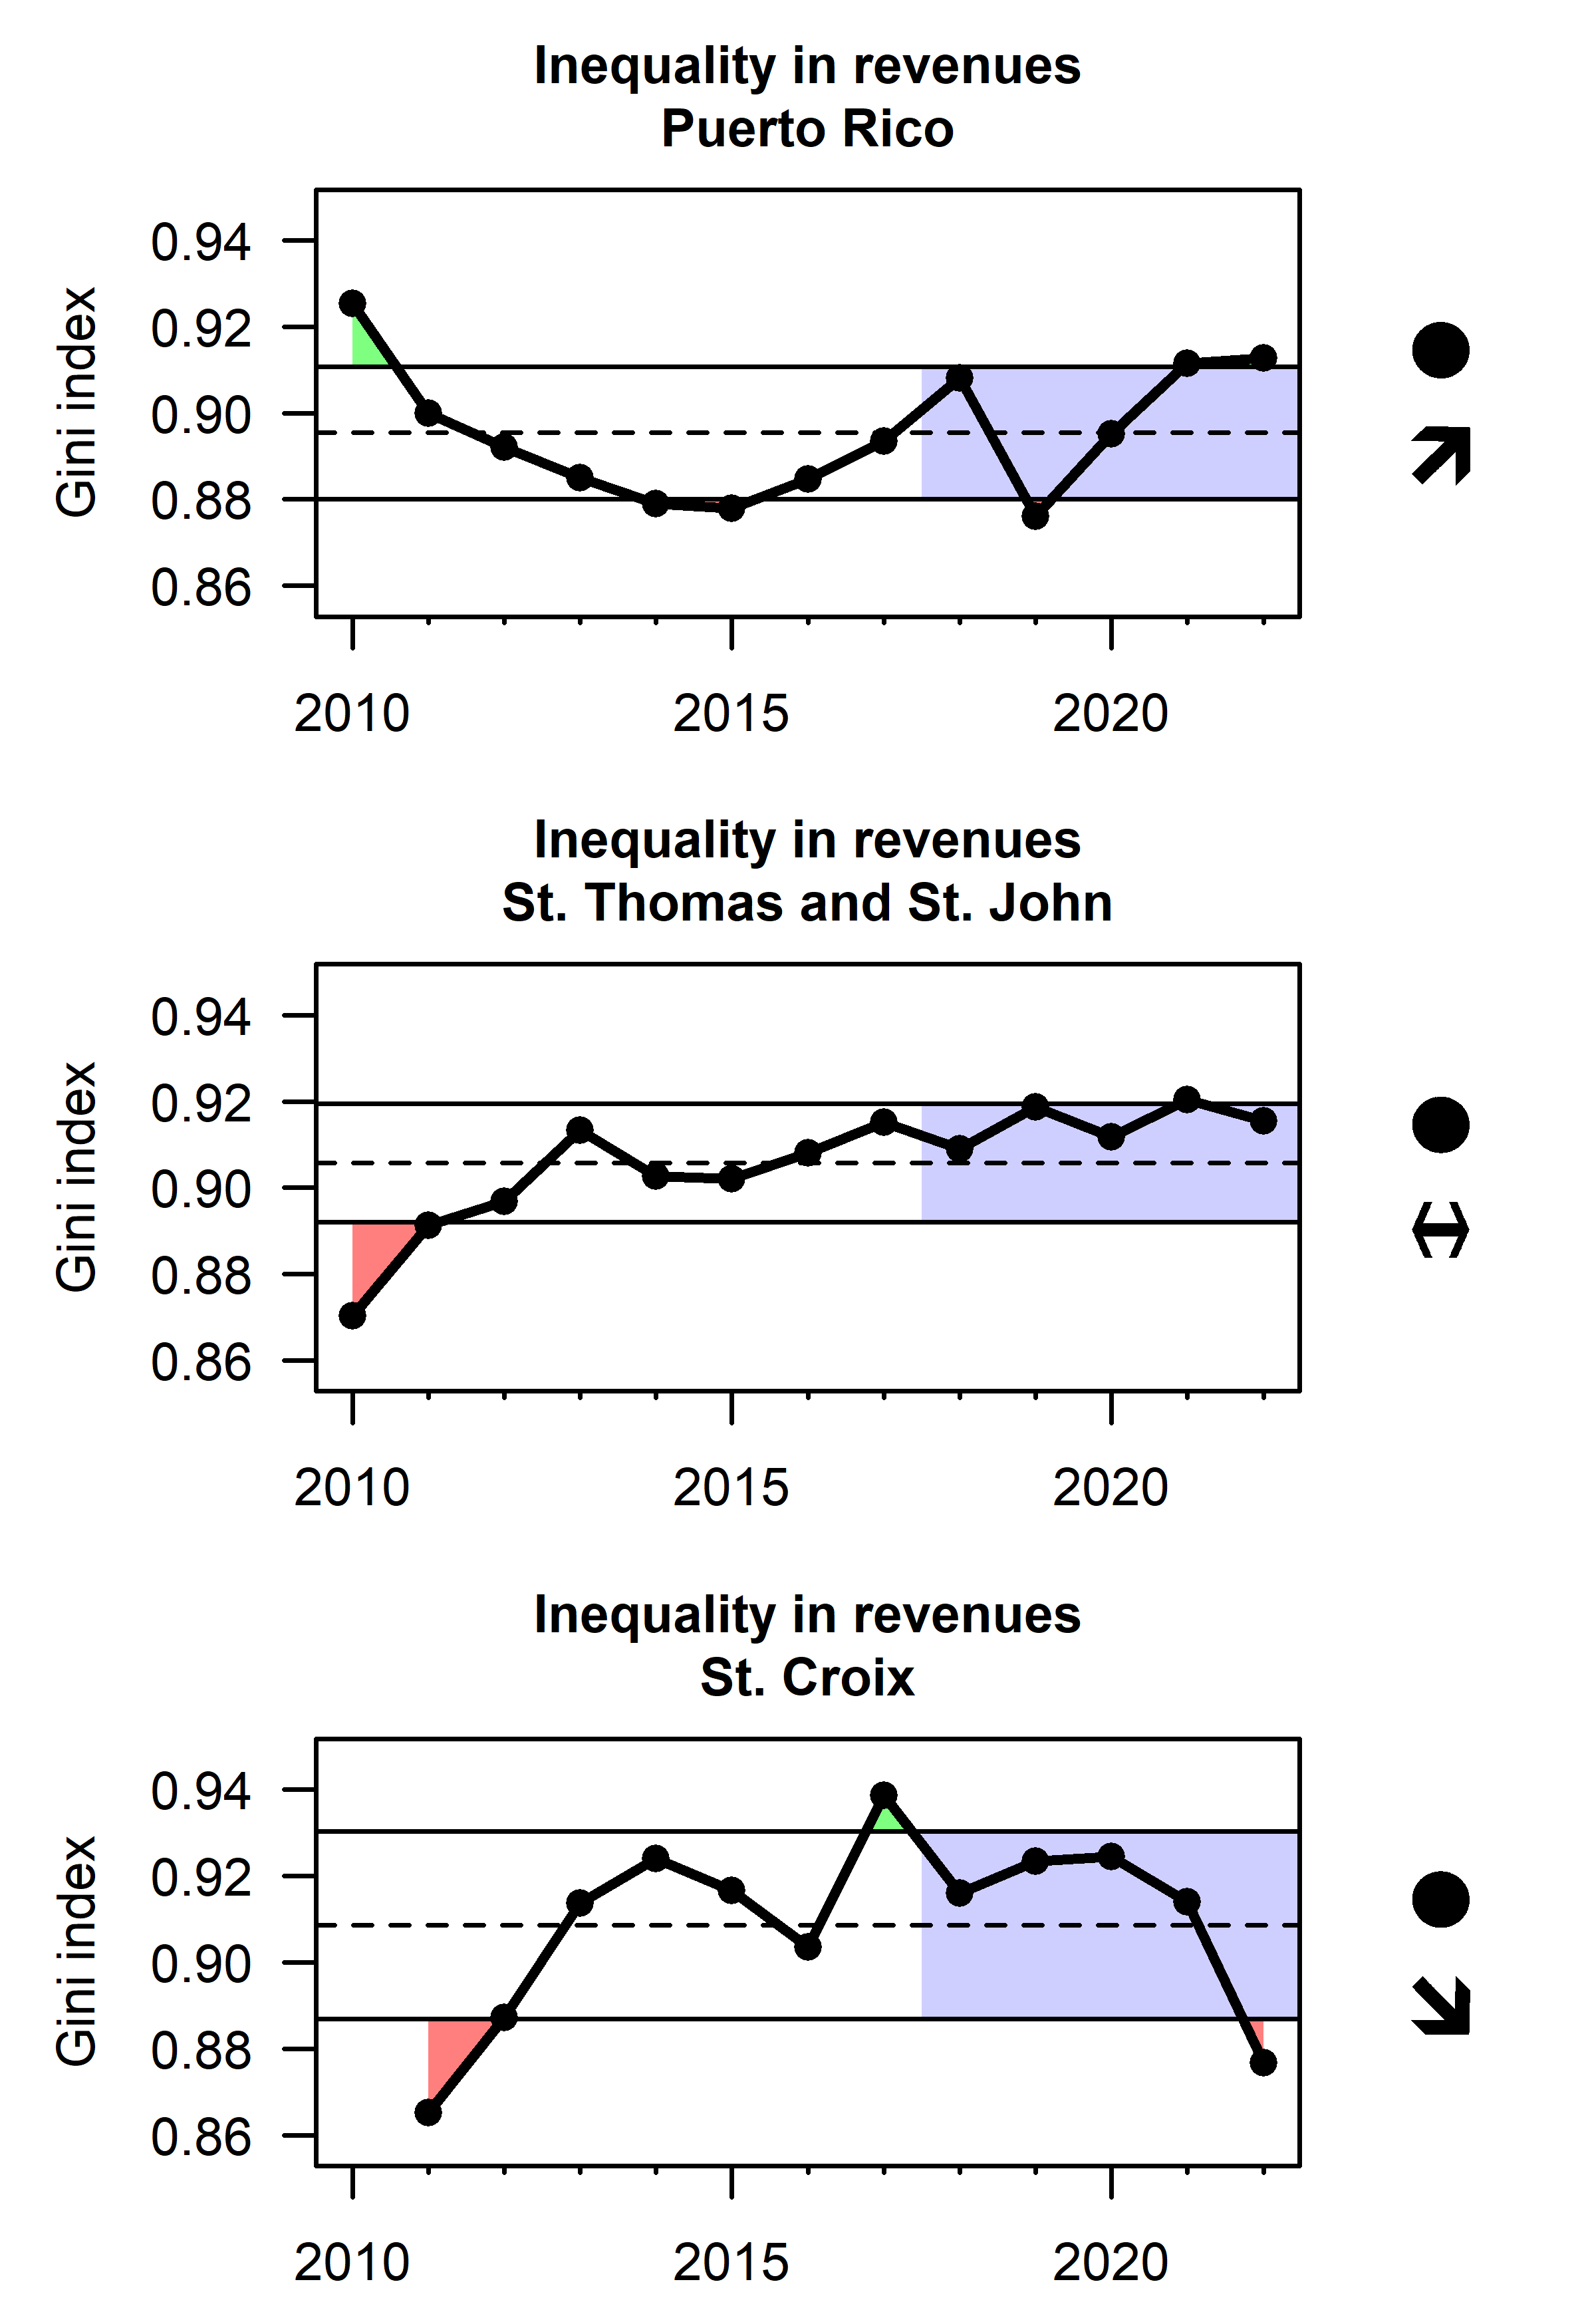
Equality in the distribution of revenues across the fishery can be represented by the Gini index which is a value ranging from zero to one, with zero representing perfect equality (revenues distributed equally among all participants) and a value of one representing maximum inequality (all revenues going to a single individual, Gini 1936). The Gini index was calculated based on reported revenues from the Caribbean Commercial Landings database, as they are distributed across the individual vessel or fisher permits (Figure 2.24). Overall, the Gini index values suggest that consolidation across U.S. Caribbean fisheries is high compared to other U.S. regions (Brinson and Thunberg 2016), though this may be an artifact of incomplete reporting, if more experienced fishermen are more consistent in their reporting. In St. Thomas and St. John, the index shows a slight increase throughout the entire time period, while there is a recent increasing trend in Puerto Rico and a recent decreasing trend in St. Croix. There are spikes in the Gini index in Puerto Rico in 2018 and in St. Croix in 2017-2018 which may be related to fishing industry impacts from hurricanes.
2.4 Engagement and participation
2.4.1 Recreational landings
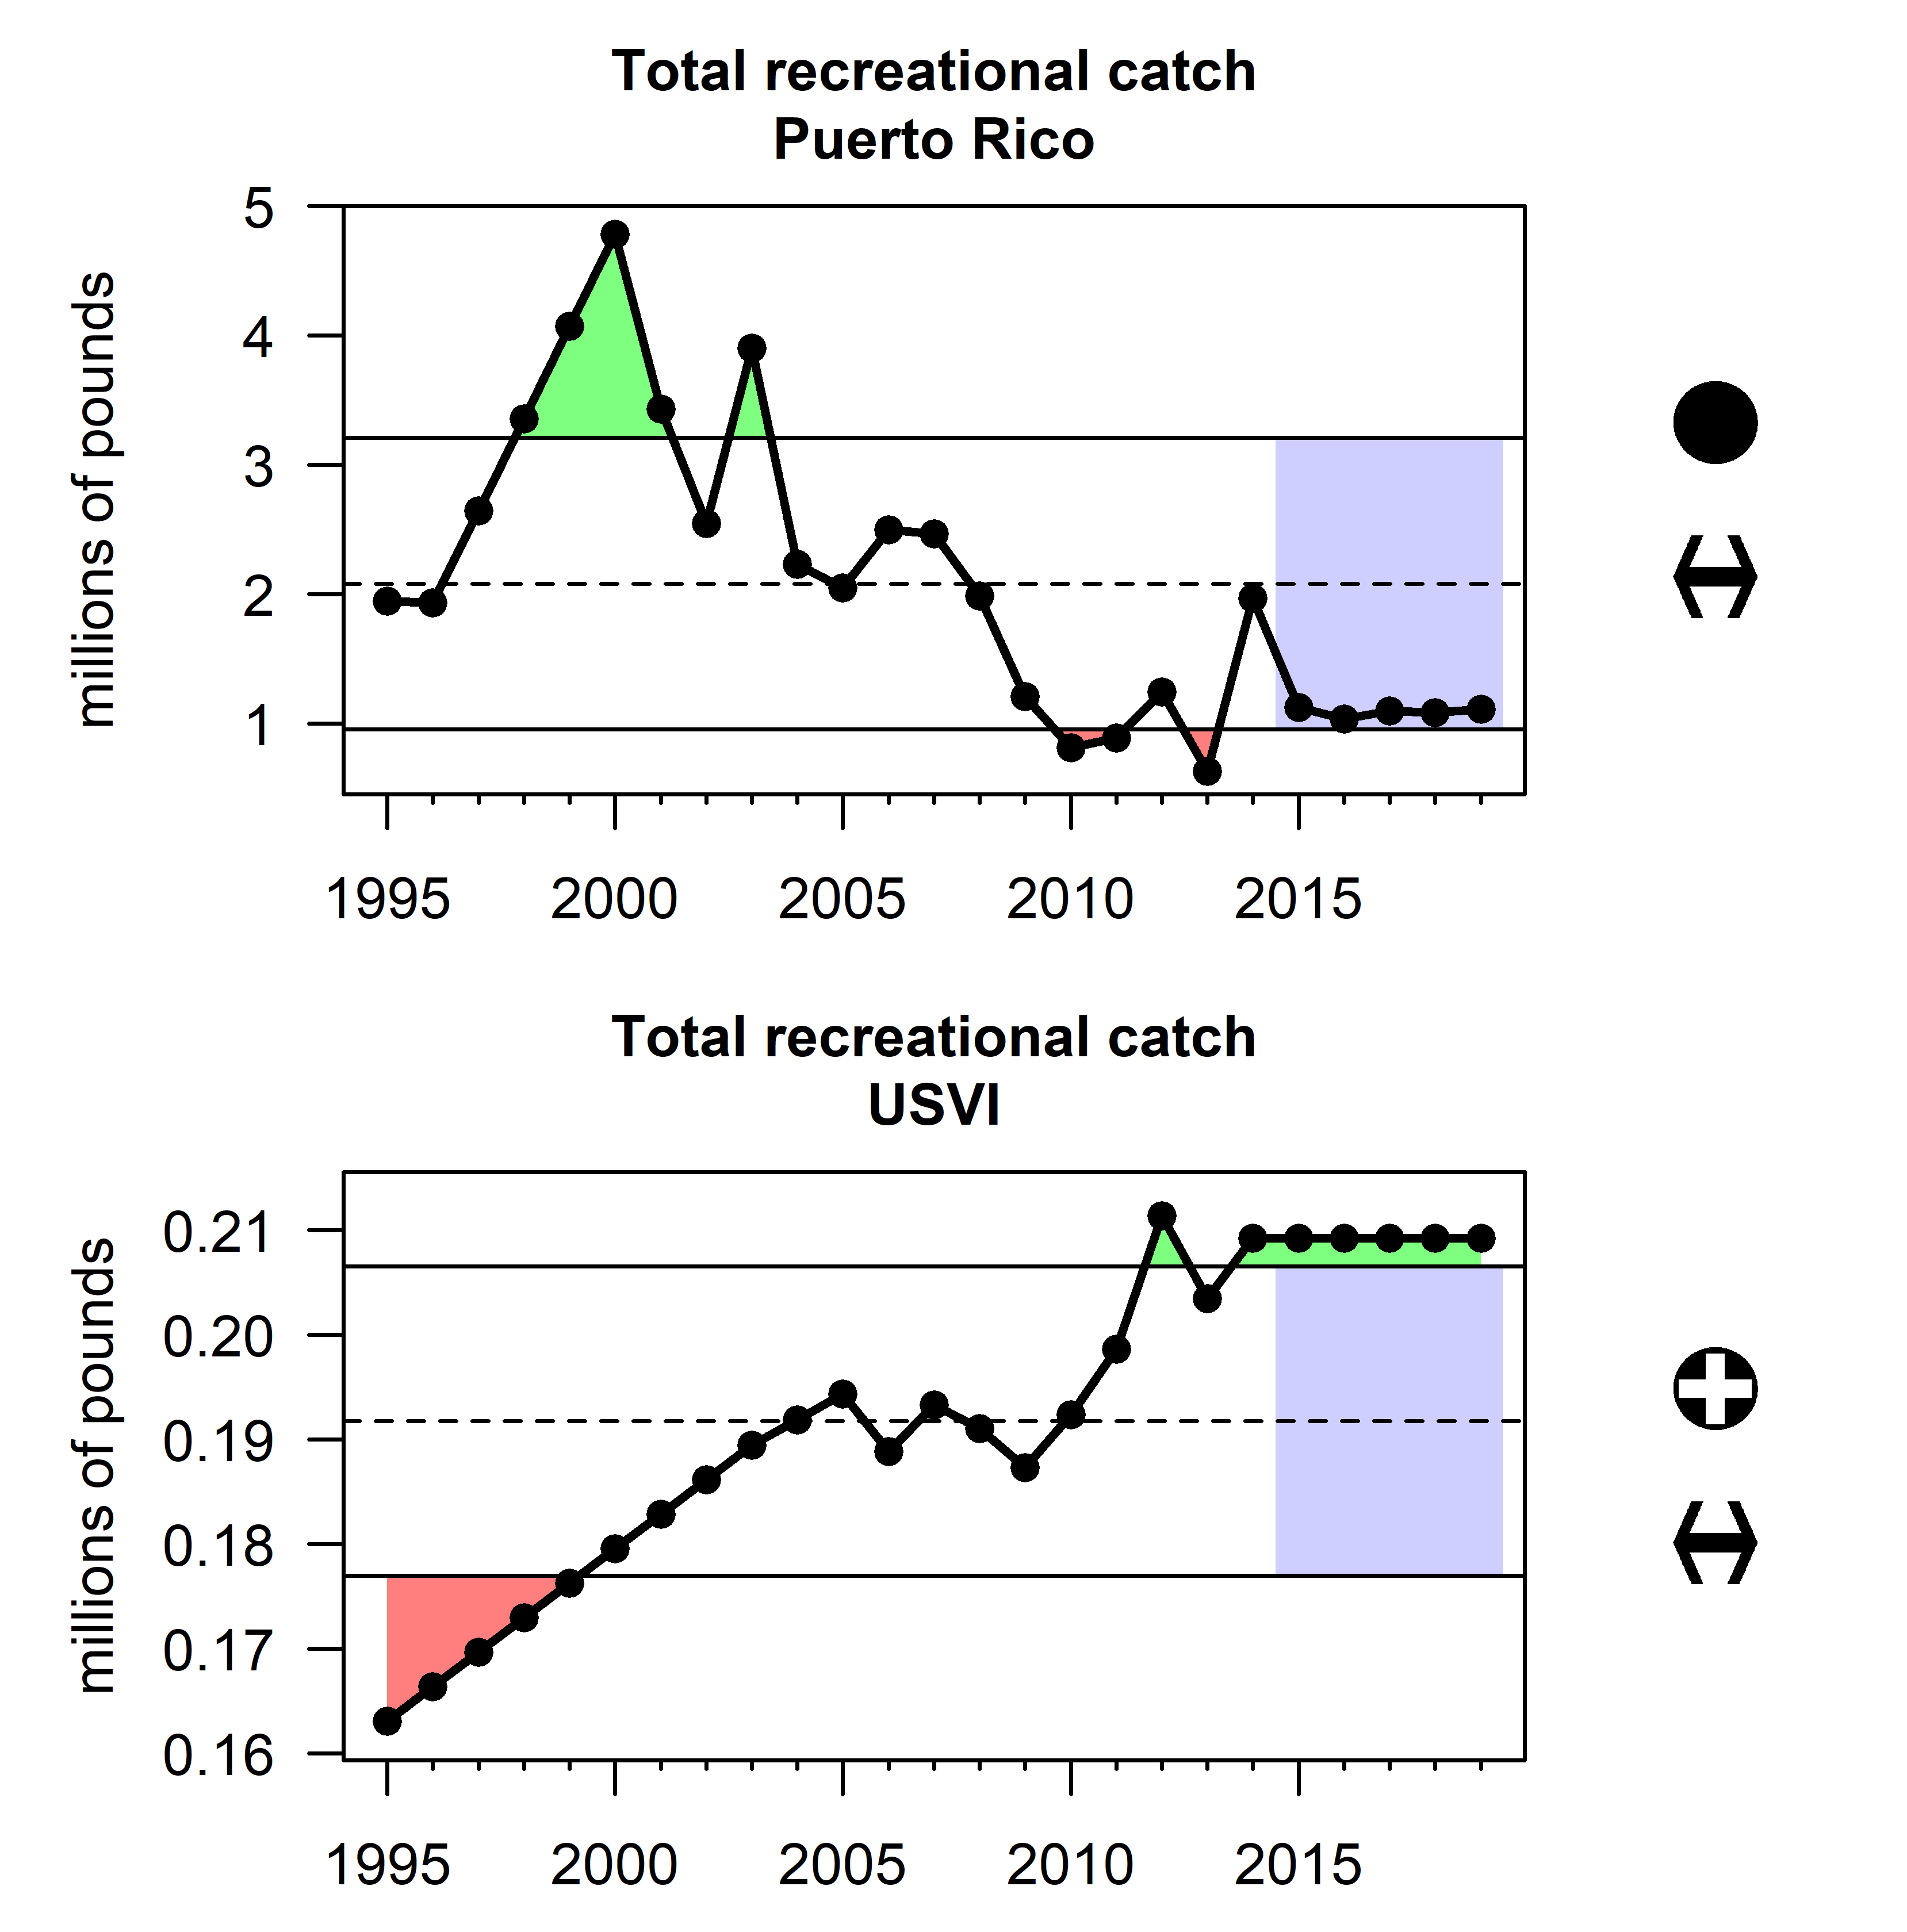
Recreational catch and effort is a major data gap in the U.S. Caribbean. The Marine Recreational Information Program collected complete years of data in Puerto Rico up until 2016, and in the USVI there are no regular monitoring programs. The Sea Around Us database estimates reported catches based on imputations and assumptions (Pauly and Zeller 2015). In Puerto Rico, catch was reconstructed by supplementing the MRIP survey with a variety of other studies conducted at various points in time. In the USVI, catch was reconstructed based on a telephone survey conducted by the USVI Division of Fish and Wildlife to estimate resident participation and catch rates, and adding a conservative estimate of tourist catches. These reconstructed estimates suggest that recreational catch has been declining over the last several decades in Puerto Rico, whereas catch has increased over the same period in the USVI (Figure 2.25).
2.4.2 Commercial fishing engagement and reliance
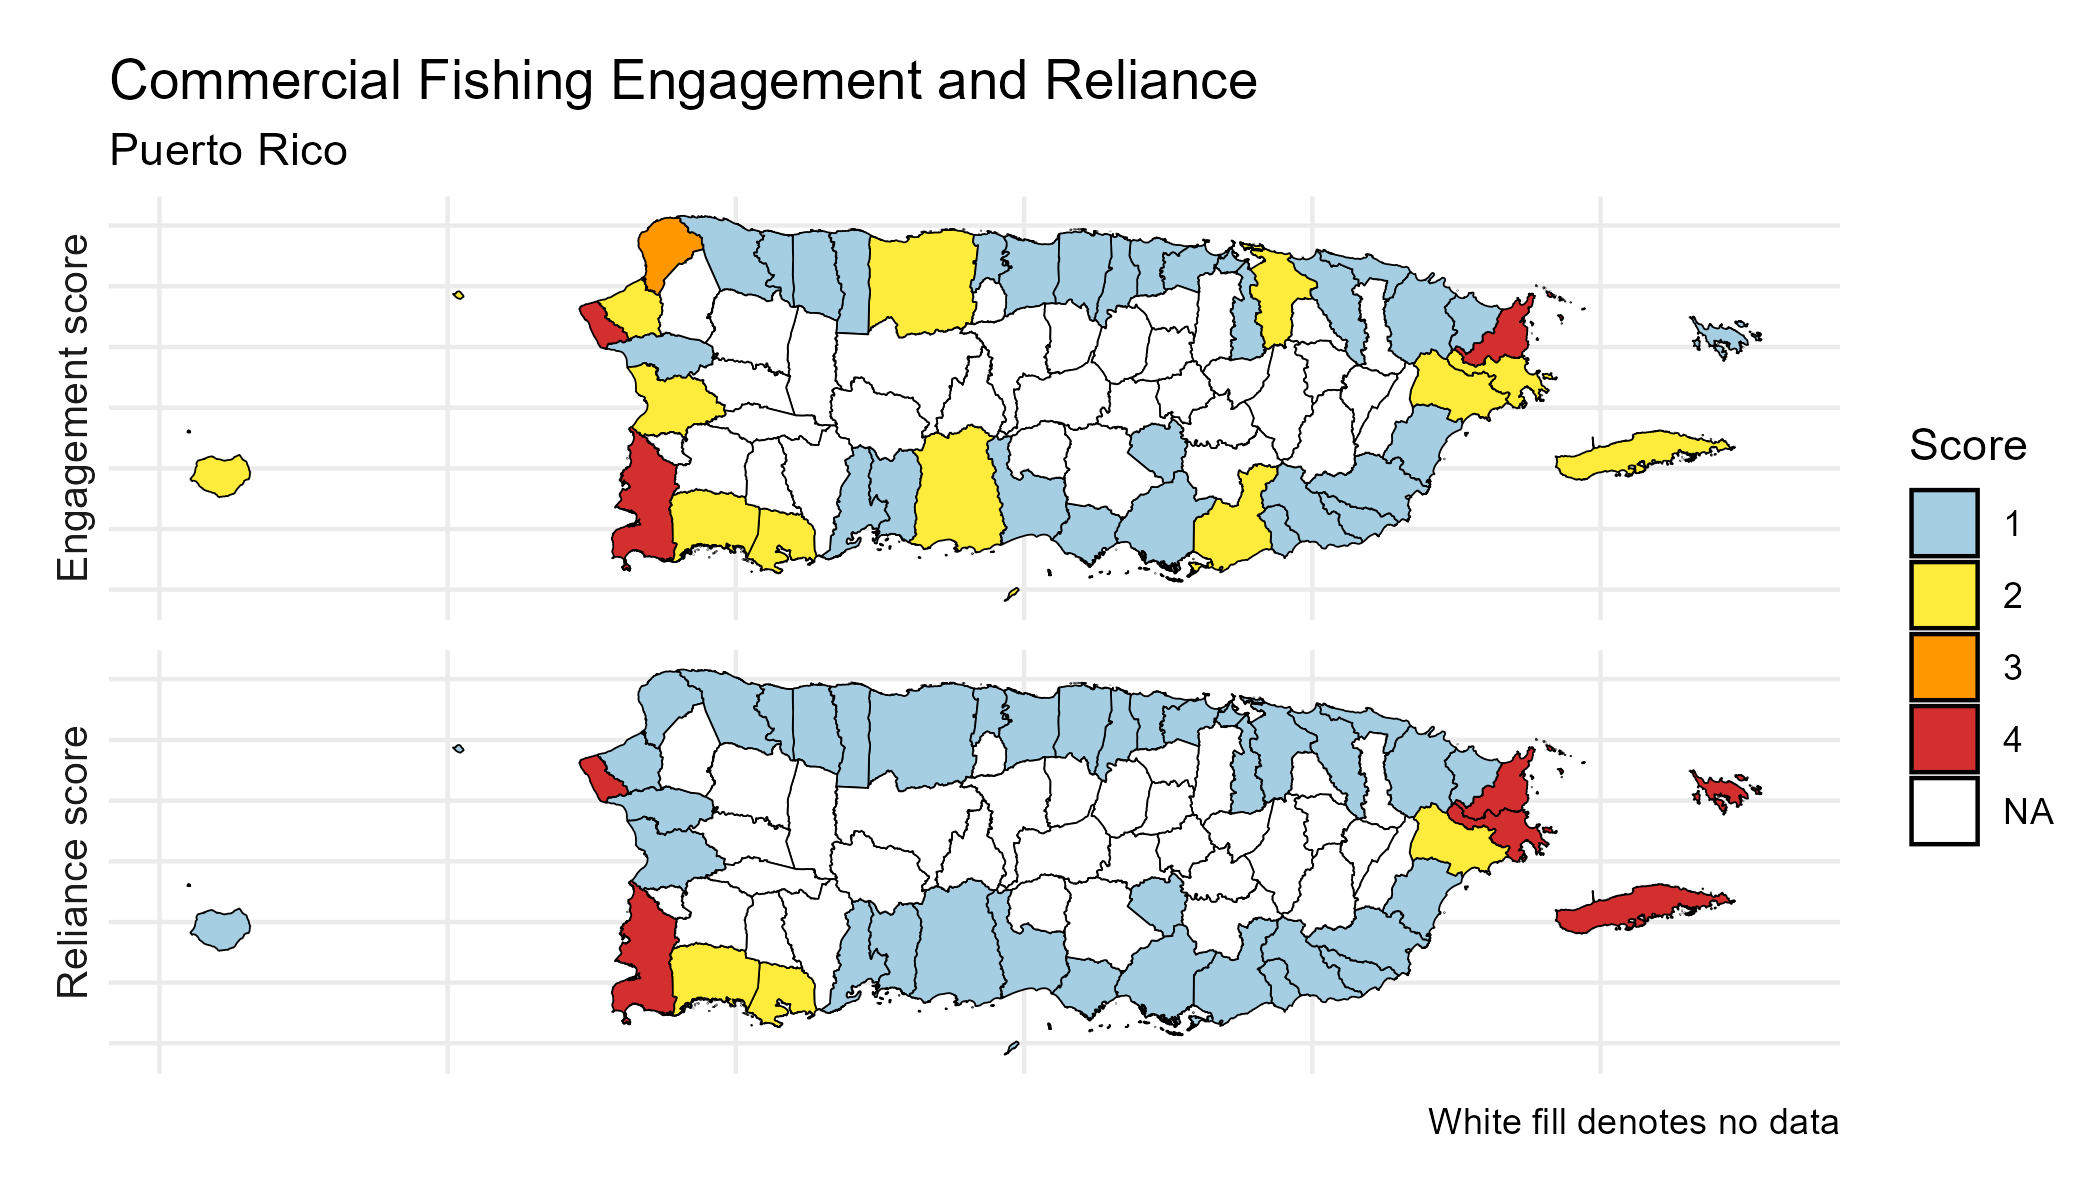
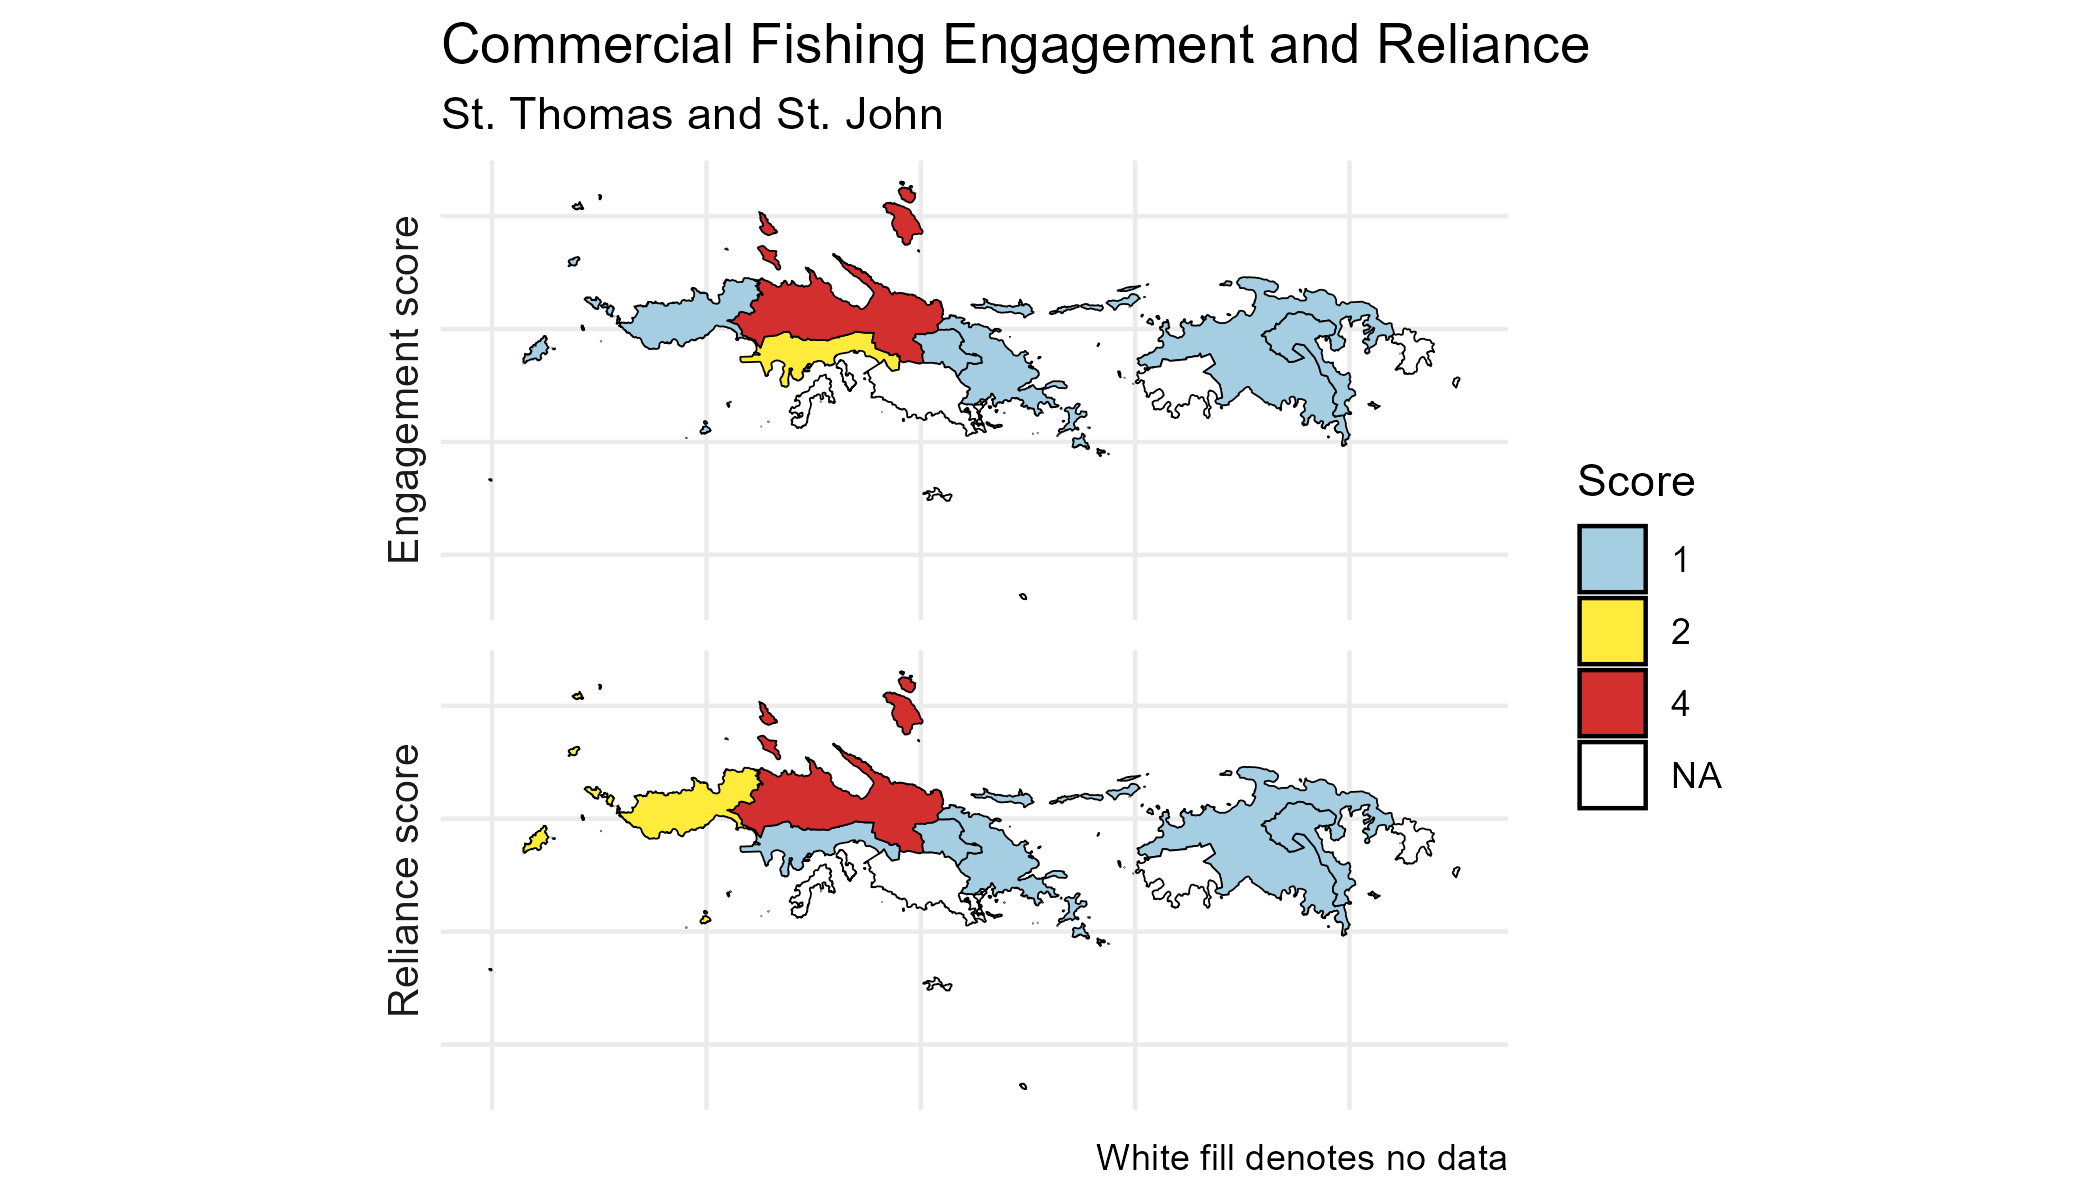
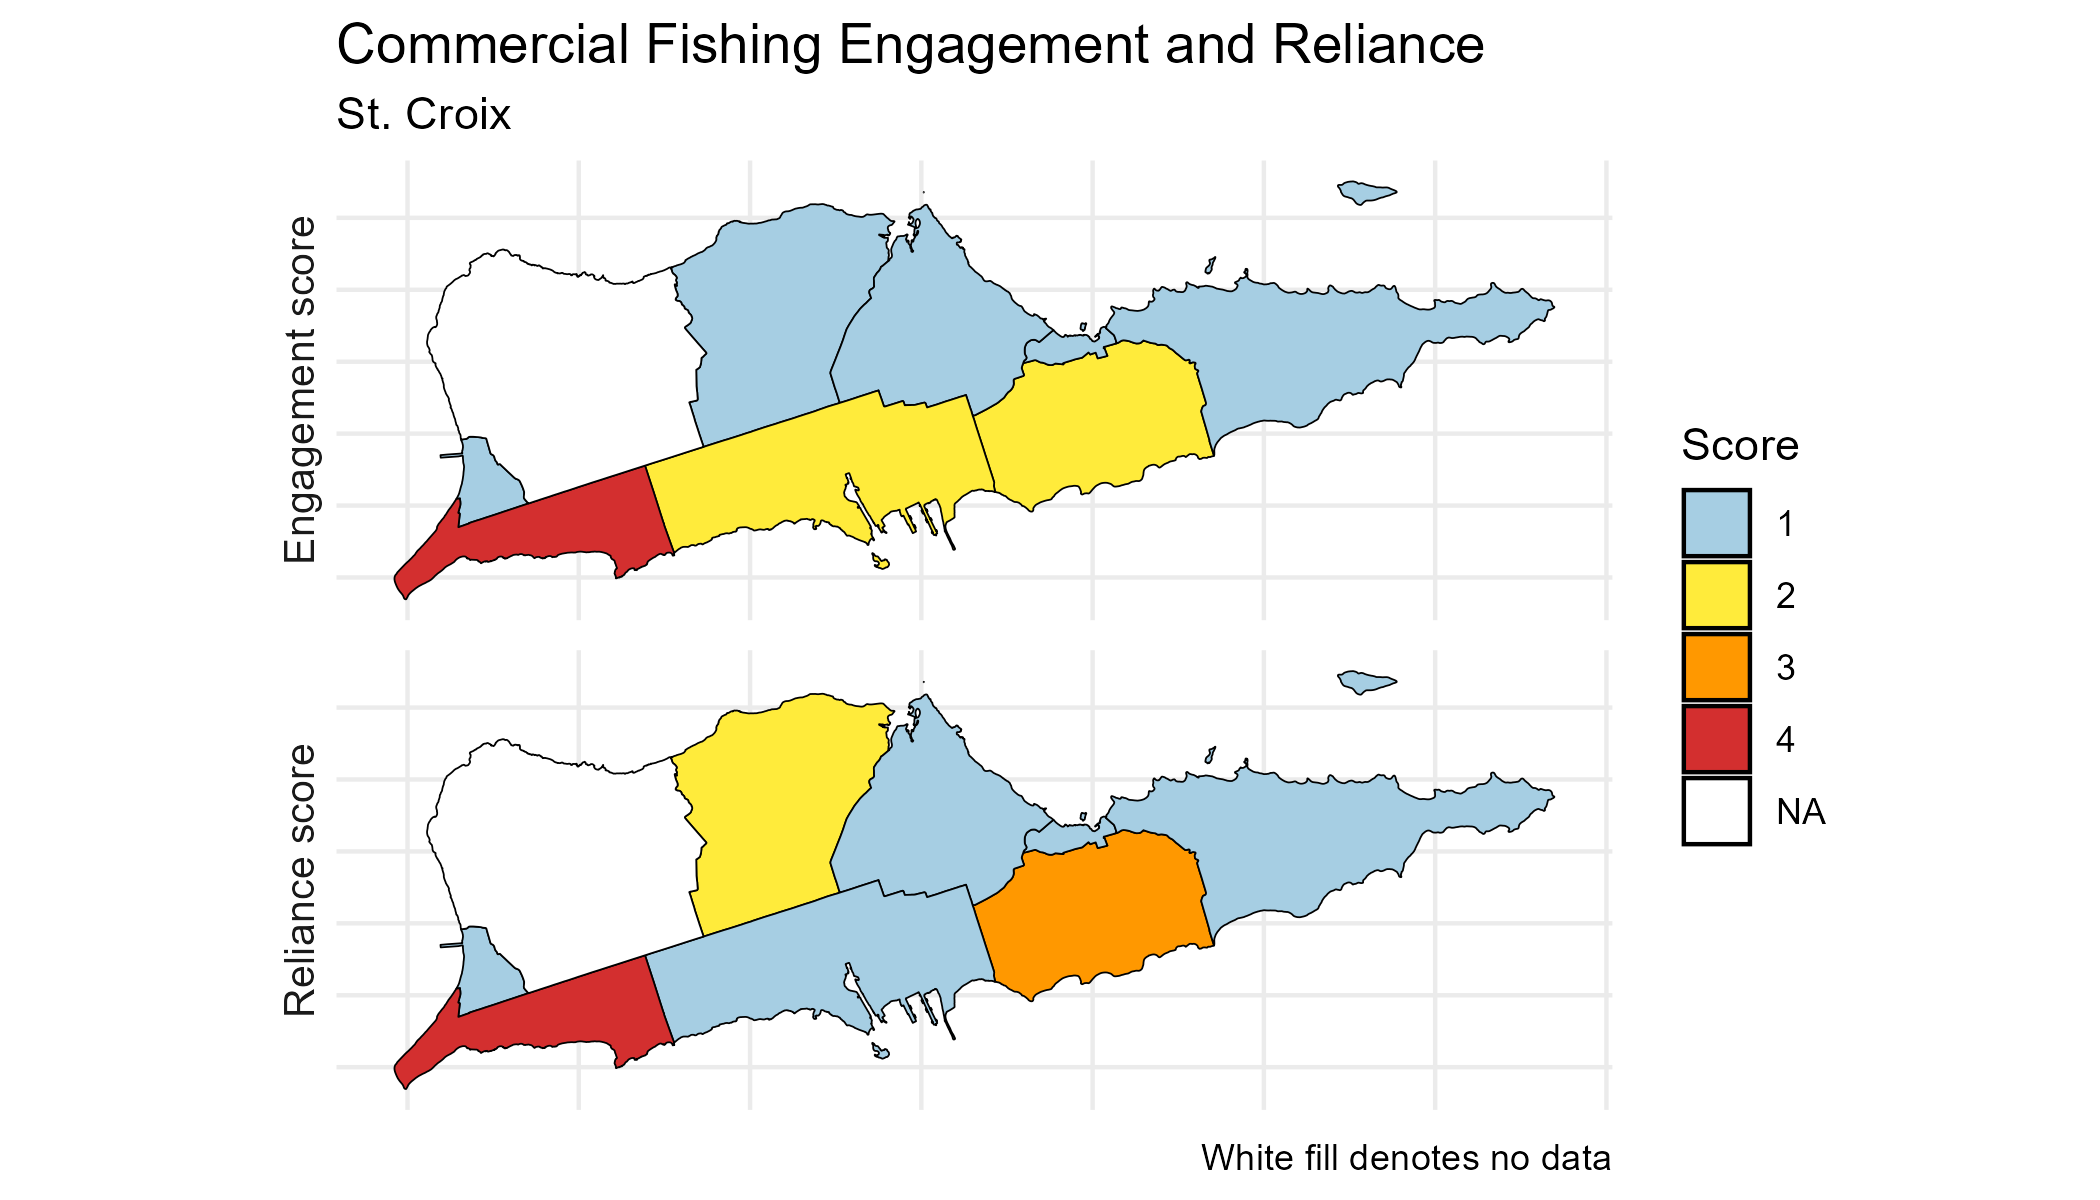
Fishing engagement and reliance indices measure the importance and level of dependence on commercial or recreational fishing for coastal communities (NOAA Fisheries 2024). Commercial fishing engagement measures the presence of commercial fishing through fishing activity as shown through permits and vessel landings. These numbers, which are reported in various NOAA Fisheries databases, are averaged for 2016–2020 and combined into a single value representing level of engagement; a higher score indicates more engagement. Commercial fishing reliance measures the presence of commercial fishing in relation to the population size of a community. Census data are based on municipality or sub-district (also for 2016–2020); a higher score indicates more reliance. Coastal communities on the west and east coasts of Puerto Rico, the north side of St. Thomas, and the southwest of St. Croix had particularly high commercial engagement and reliance for 2016–2020 (Figure 2.26, Figure 2.27, Figure 2.28). Note that in Puerto Rico, fishers are generally residents of their respective communities and the commercial fishing activity is reported by landing site. In the USVI, individuals may live in locations that are not adjacent to their landing sites, and the permits and landings are tied to their home address; thus the indicator represents not where the fishing activity is taking place, but rather the location of human communities tied to the fishing activity.
2.5 Bycatch reduction
2.5.1 Changes in gear type
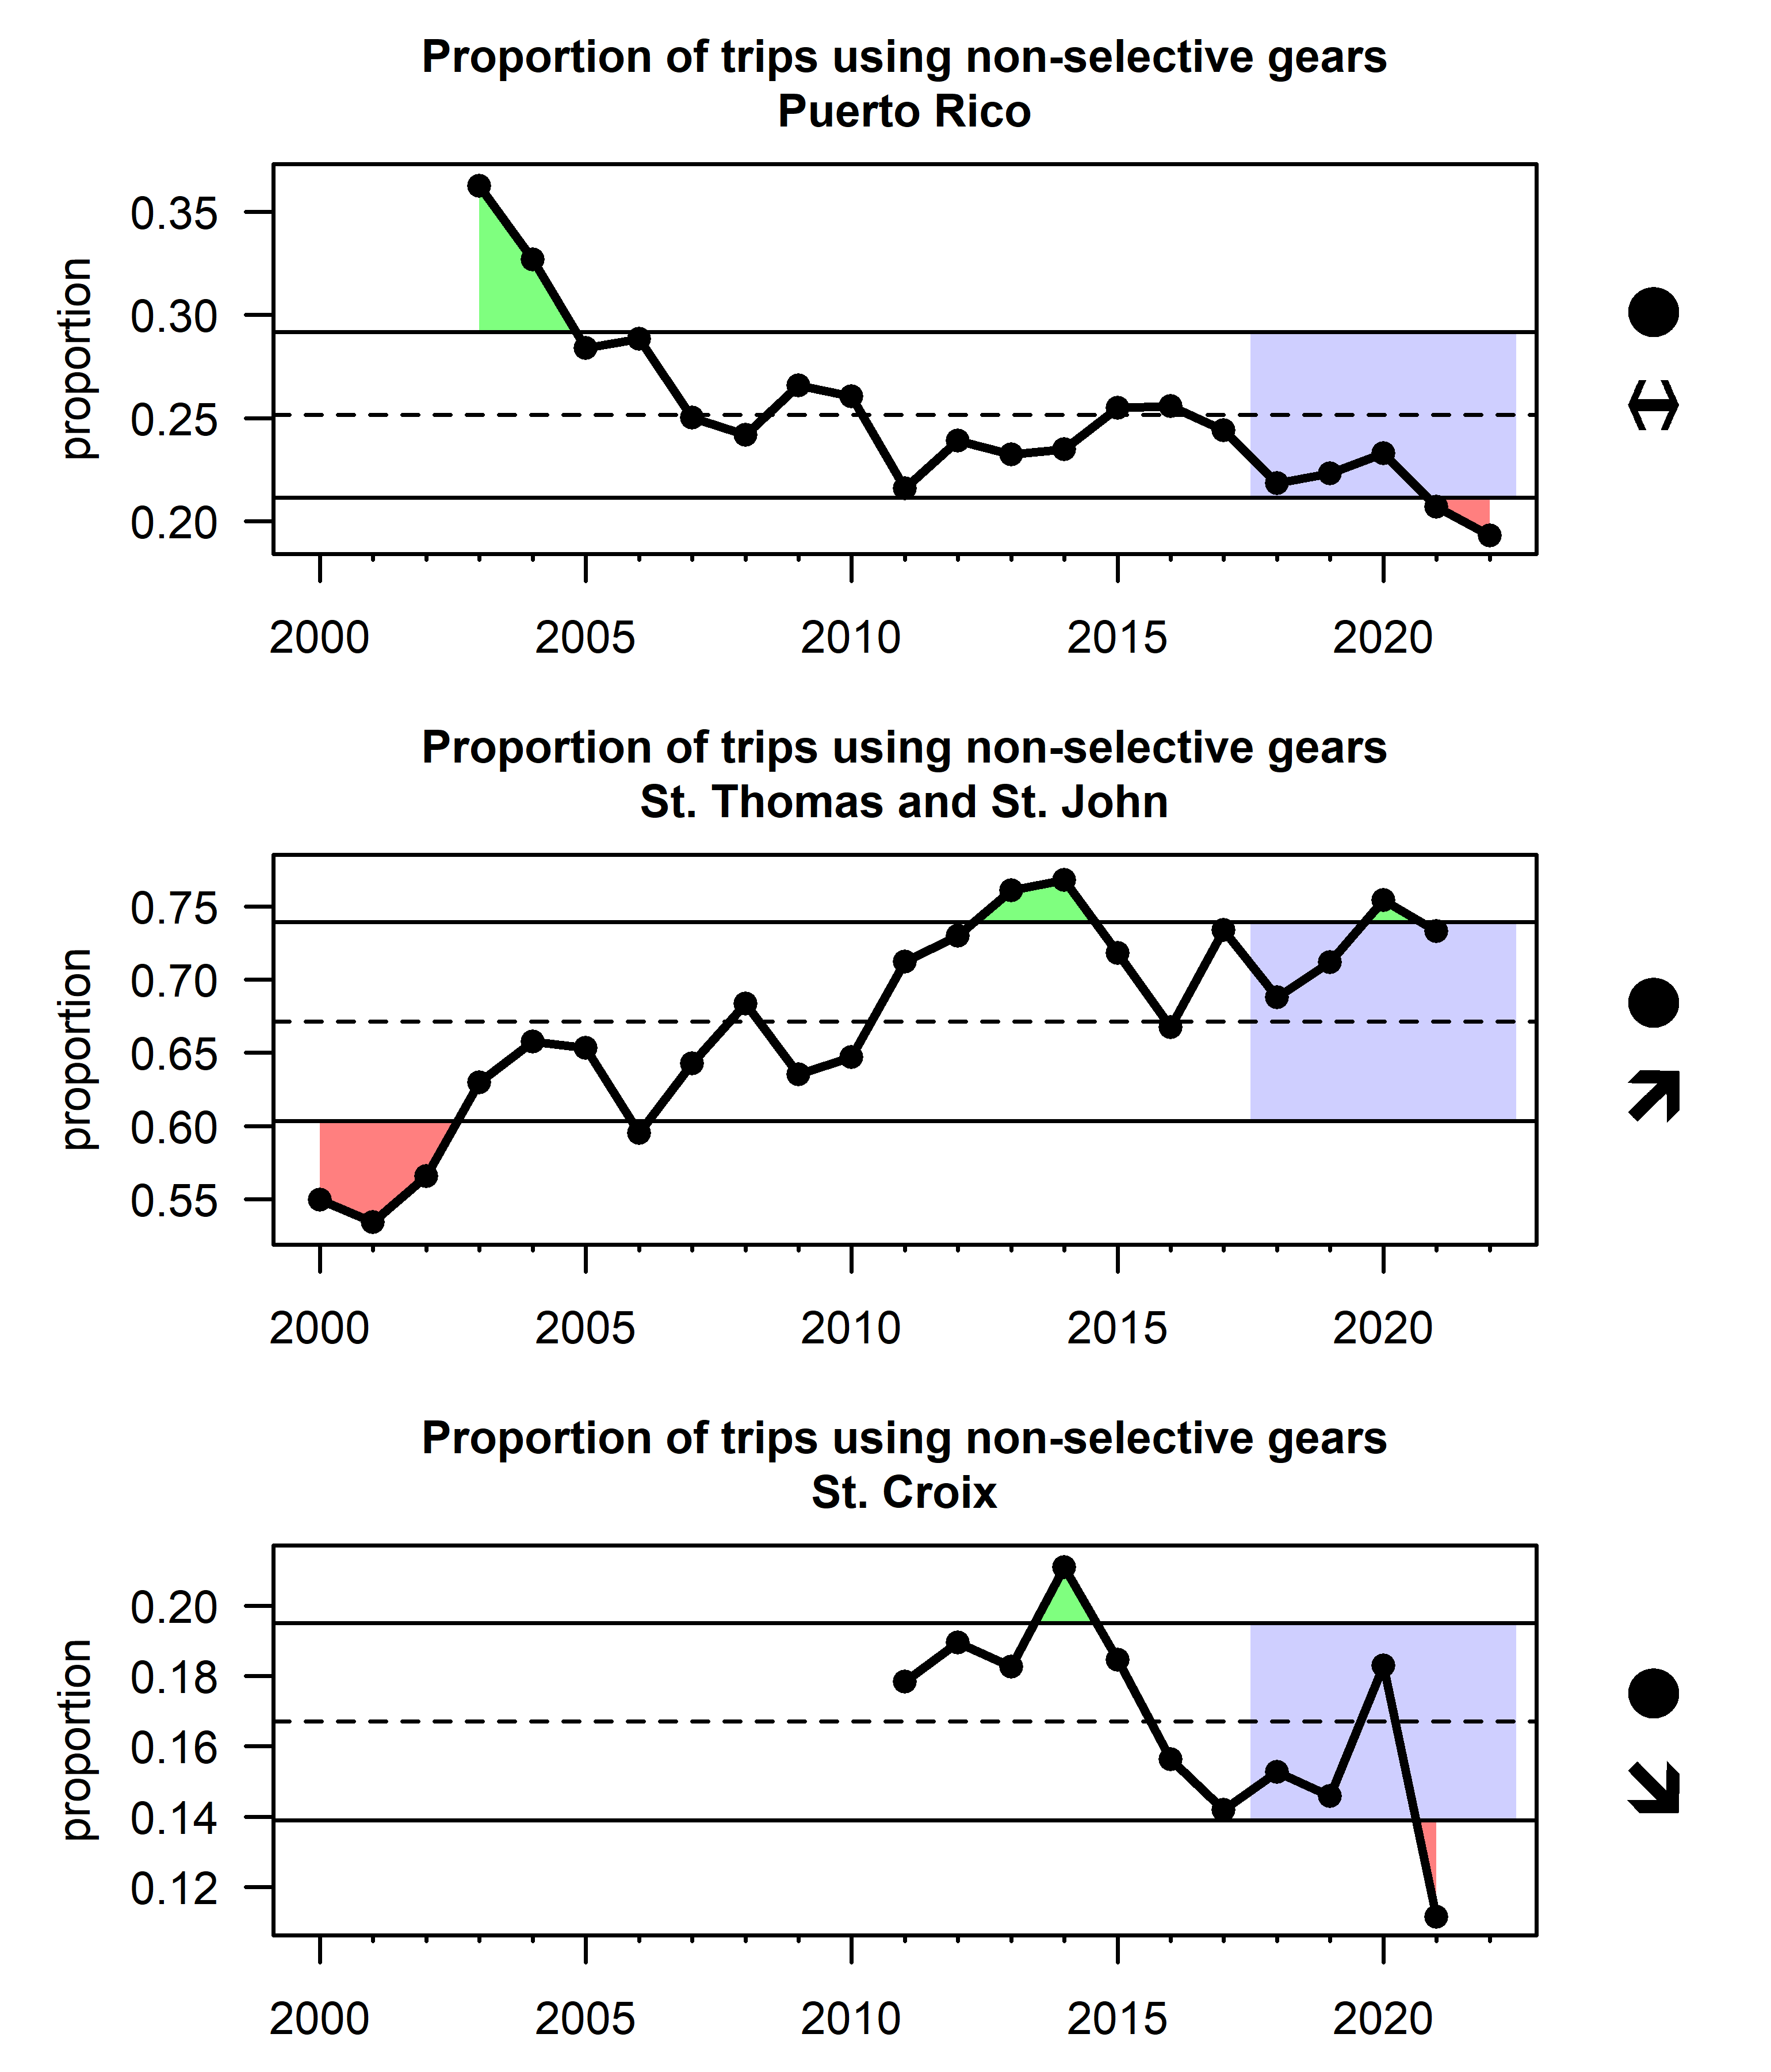
Data on bycatch in the U.S. Caribbean are generally lacking; target species and bycatch are not differentiated on most logbook forms and the region has minimal observer program coverage (and only on the pelagic longline fleet). The selectivity of gear can be considered as some gear types are highly selective (e.g. spearfishing and diving) while other gear types capture a wide range of target and non-target species. The proportion of non-selective gear (traps and nets) is calculated from the Caribbean Commercial Landings database, as a proxy for bycatch in the fisheries. Overall the use of these gear types has been decreasing over time in Puerto Rico and St. Croix; in St. Thomas and St. John there has been a general increase over time though the recent trend has been stable (Figure 2.29).
2.6 Governance
2.6.1 Regulatory trends
In the Southeastern United States (including the U.S. Caribbean), management history data have been cataloged and standardized by the NOAA Southeast Fisheries Science Center’s, Fisheries Statistics and Sustainable Fisheries Divisions in collaboration with NOAA’s Southeast Regional Office and the Cooperative Institute for Marine and Atmospheric Studies. The Github repository SEFSC-ODM-Management-History (https://github.com/SEFSC/SEFSC-ODM-Management-History) was used to access and process the available management history data.
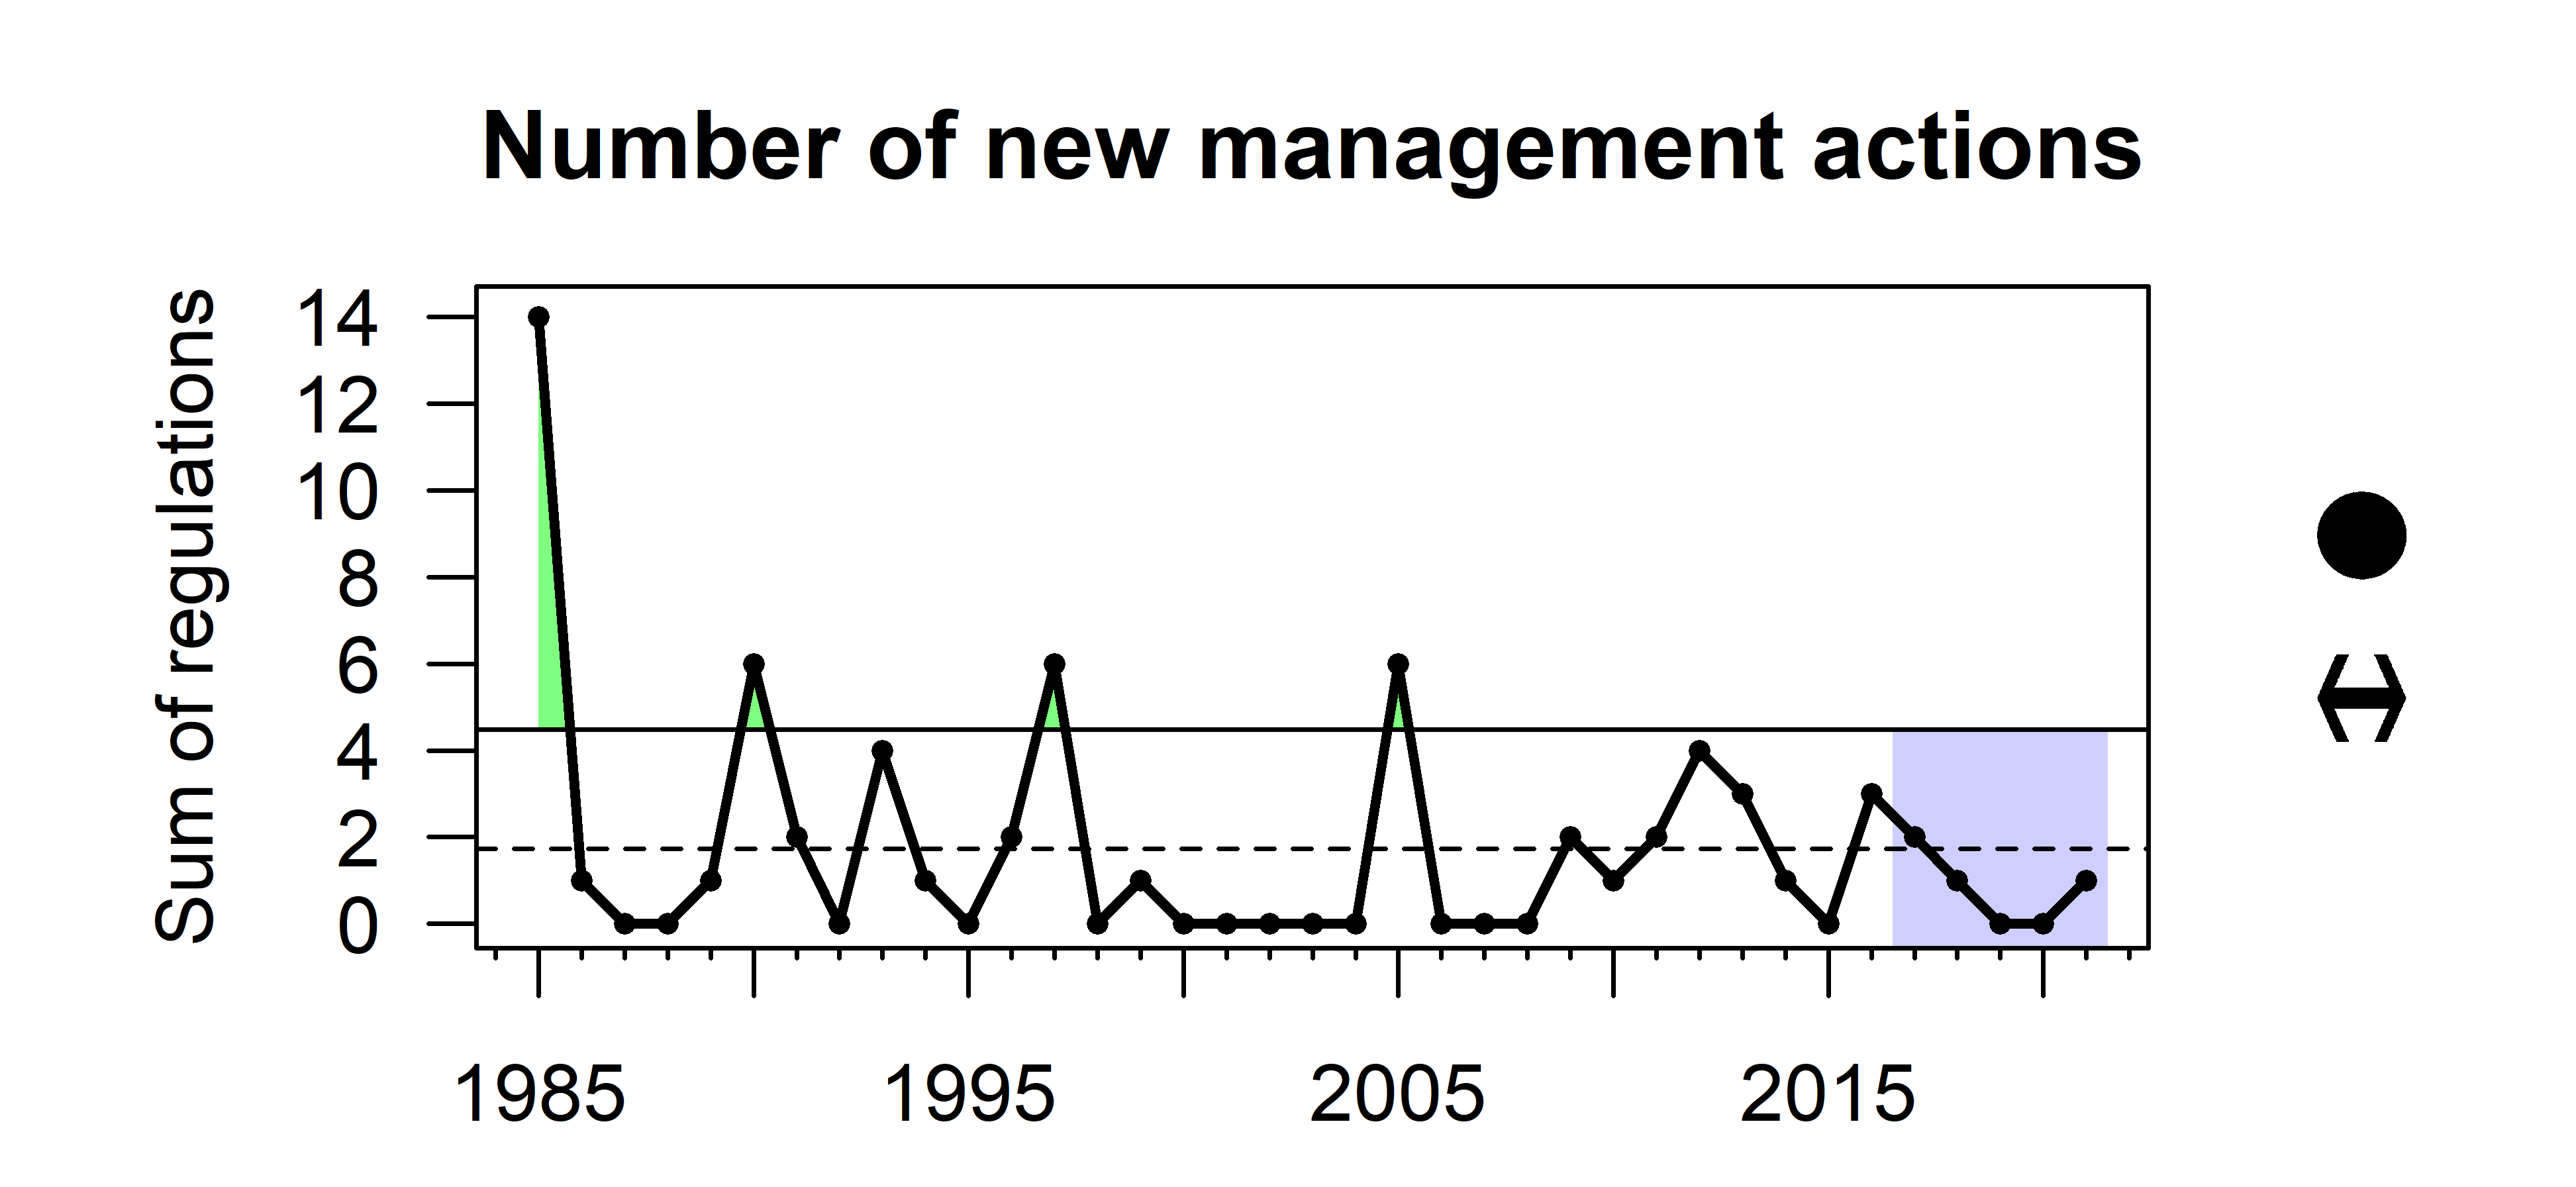
The records in the database represent Federal Register (FR) changes in management actions that affect federally managed species. FR notice data were available in the management history database from 1985-2021. The number of unique FR sections within each FR notice were summed annually as an index of regulatory trends in the U.S. Caribbean. The FR section is the part, chapter, and section in which a specific regulation is contained within an FR notice. Management actions have occurred in waves, often increasing with changes to Fishery Management Plans, like the establishment of the Reef Fish FMP in 1985, the establishment of the Queen Conch FMP in 1997, and a major amendment to the FMPs of the U.S. Caribbean region in 2005. The data were only available through 2021, but in 2022 the U.S. Caribbean transitioned from a single Caribbean-wide to three island-based fishery management plans. This major management change was associated with several new regulations and will likely impact the regulation trends indicator in future iterations of this report.
2.6.2 Species with informative catch limits
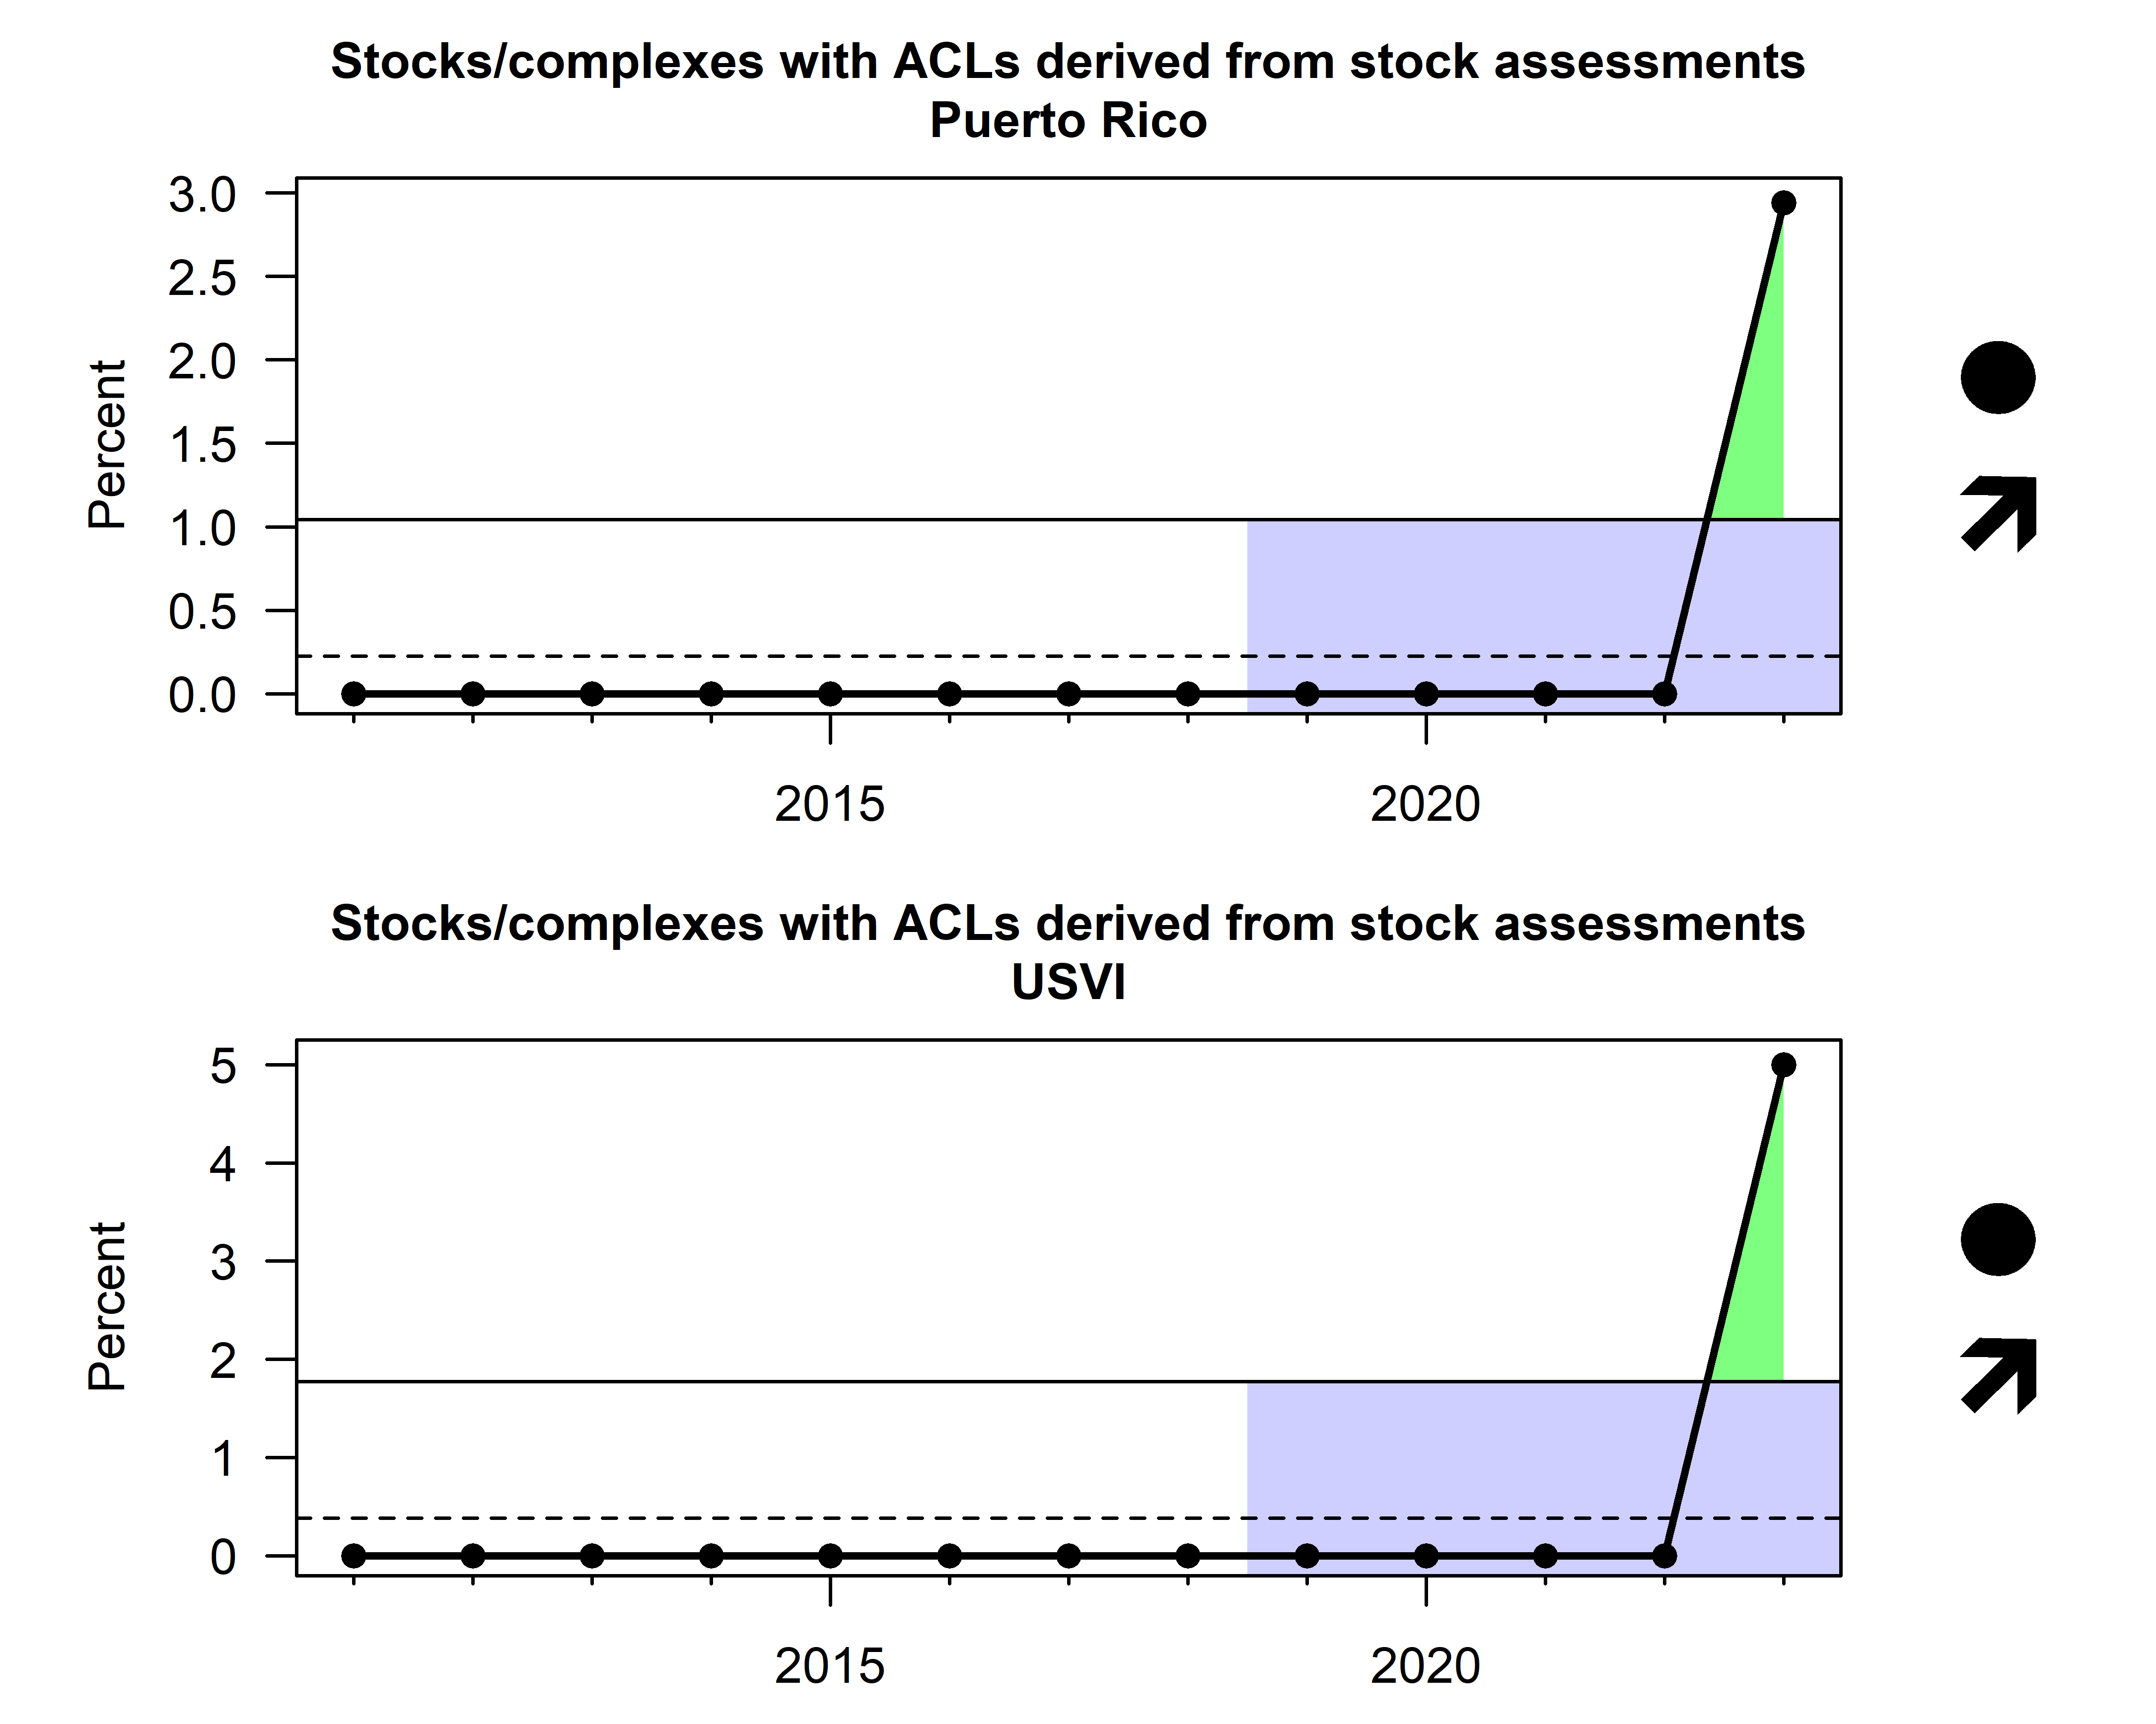
U.S. Caribbean fisheries are highly diverse; over 300 individual species have been recorded in the landings database and there are 54 stocks or complexes within the three Island-based Fishery Management Plans. At the same time, the region is extremely data-limited, with high uncertainty in landings data and lacking reliable indices of abundance, and most annual catch limits are derived using Tier 4 of the control rule included in the FMPs (based on landings over a defined time period). The percentage of stocks or complexes with annual catch limits informed by stock assessments is a useful indicator for tracking progress toward more robust management advice in the region. In recent years, progress has been made and some stock assessments have been accepted for management advice (Figure 2.31).
2.6.3 Education and outreach events
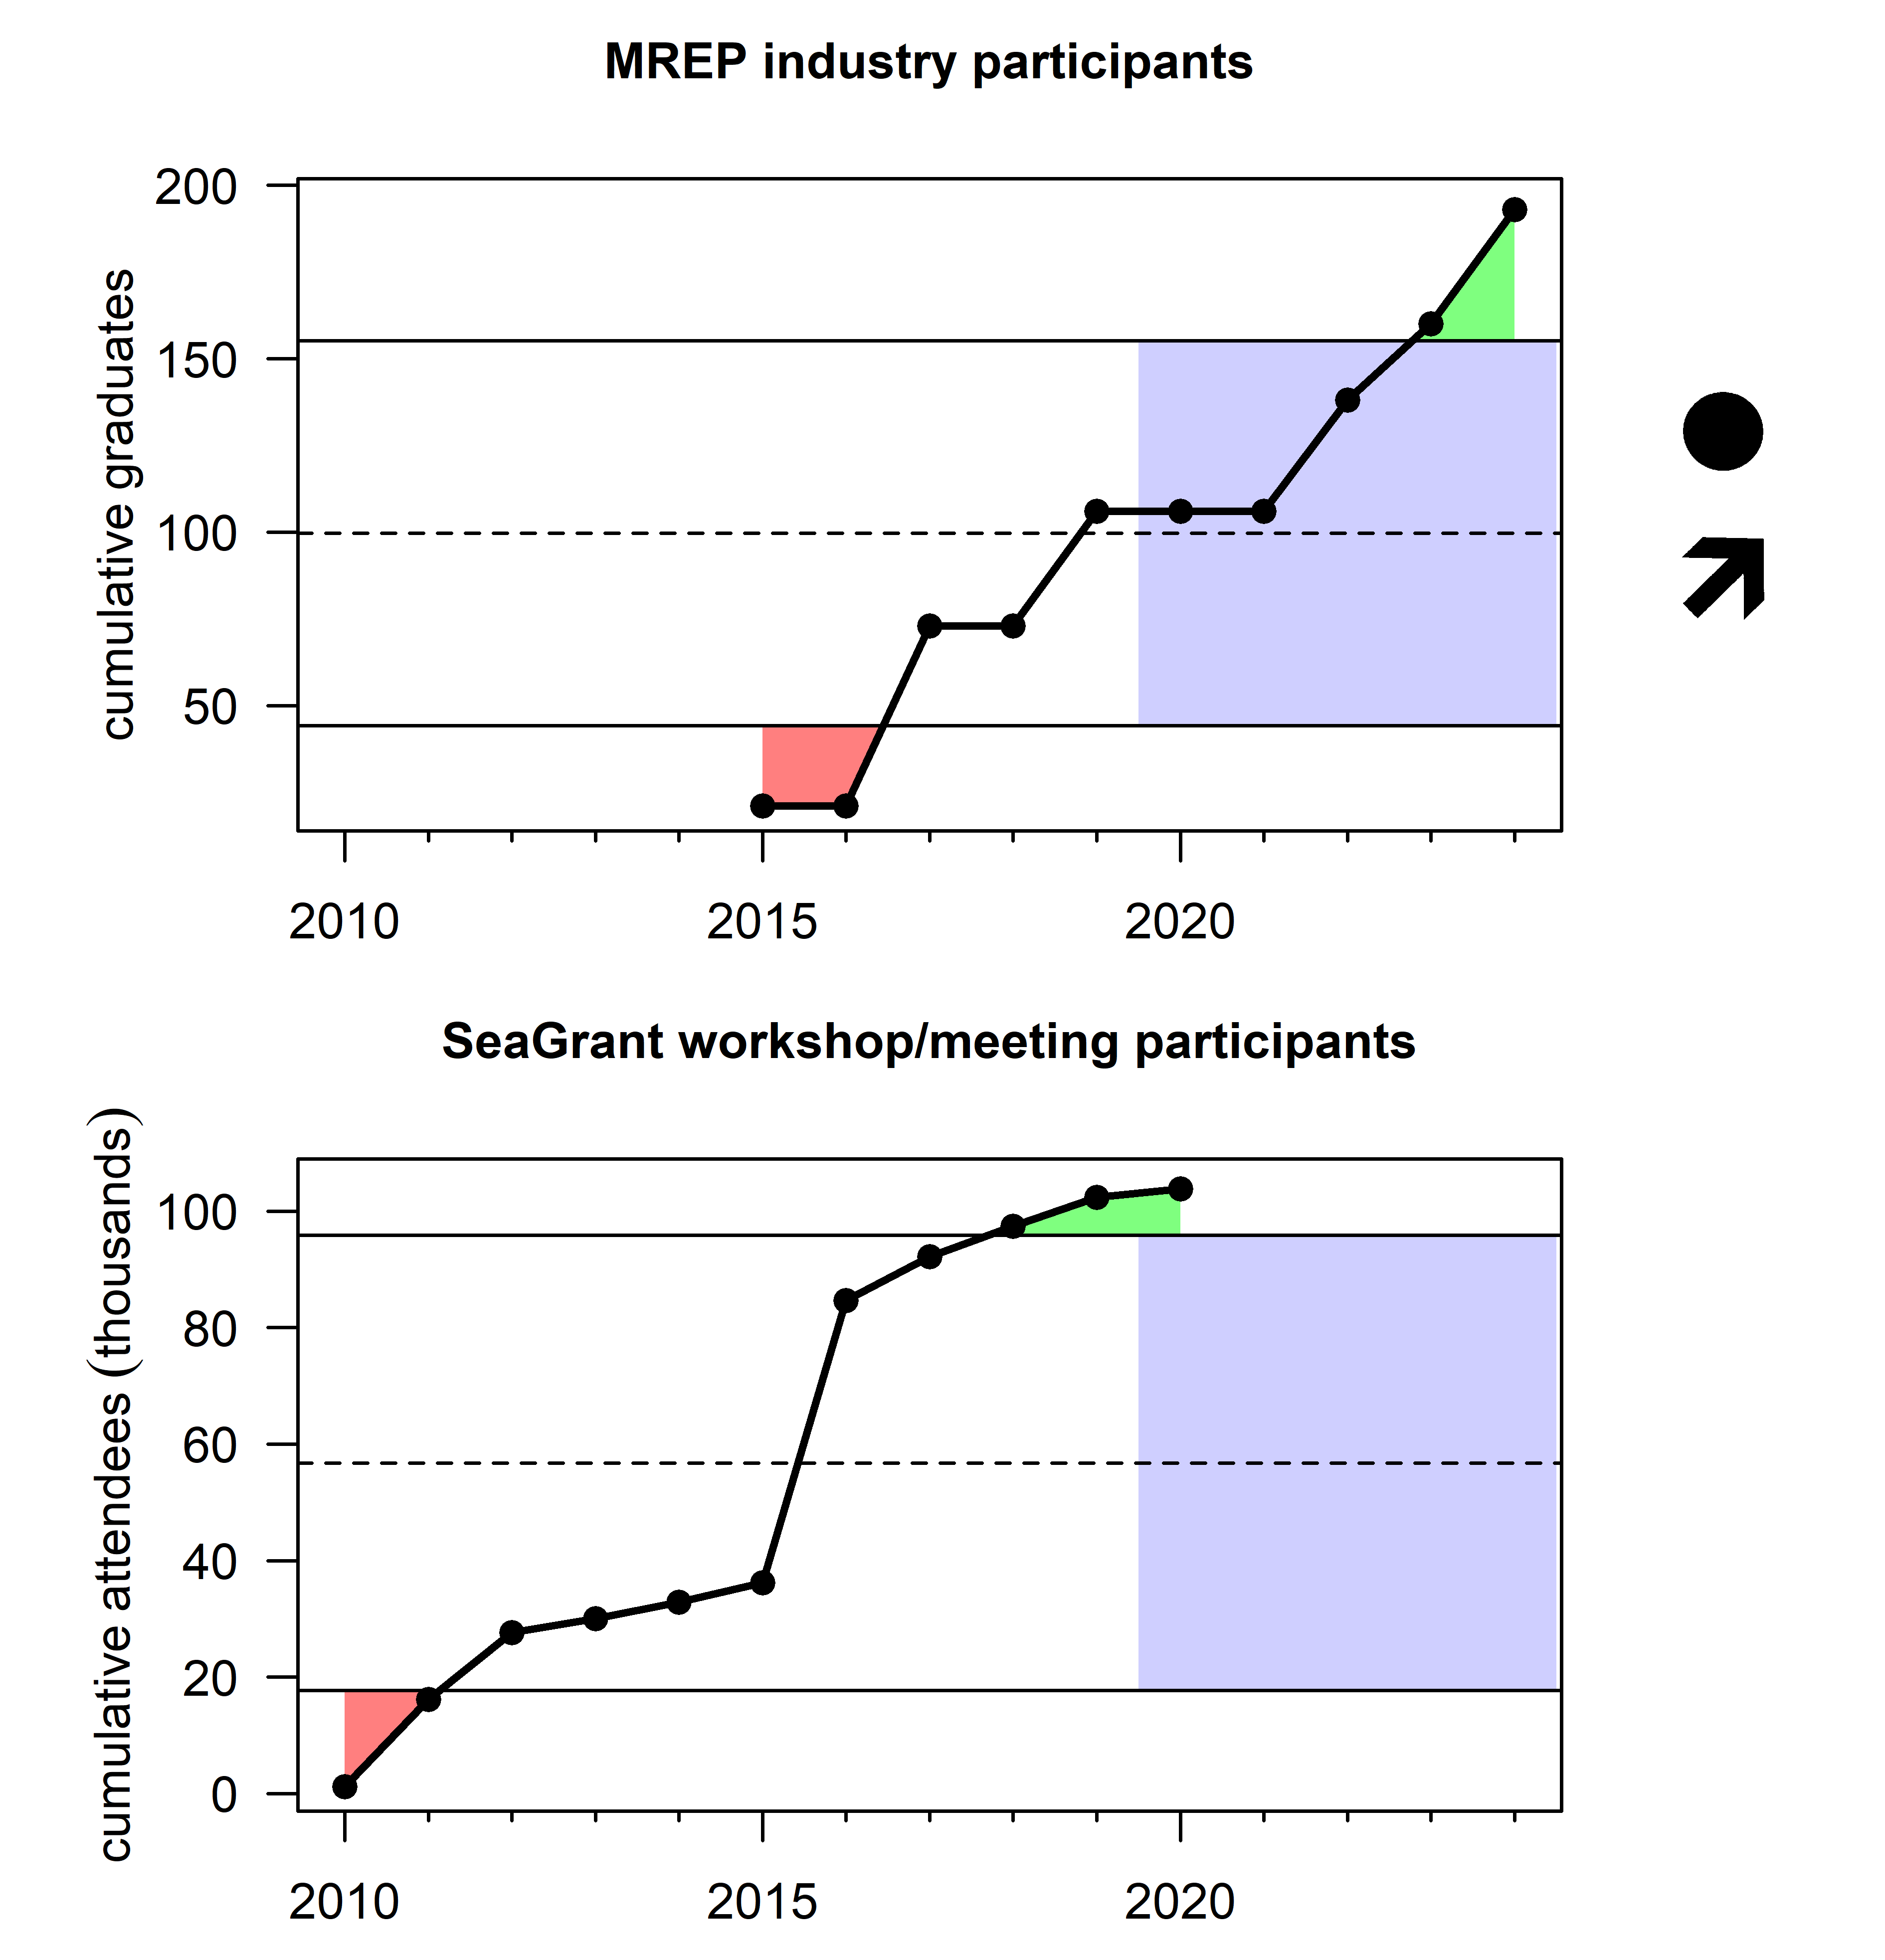
Programs such as the Marine Resource Education Program (MREP) and NOAA SeaGrant have made substantial gains in outreach and education in the U.S. Caribbean region. MREP is a program developed for fishermen, by fishermen, and is widely recognized as a key venue for engaging industry members and building trust. Sea Grant is a federal-academic collaboration that supports research, education and extension to support coastal resource conservation, conducting outreach in the form of workshops and meetings. The number of participants benefiting from MREP and SeaGrant programs has increased rapidly in recent years. The actual impact of these programs is even greater, as graduates and attendees tend to become spokespeople within their communities and continue to spread knowledge by word-of-mouth (Figure 2.32).
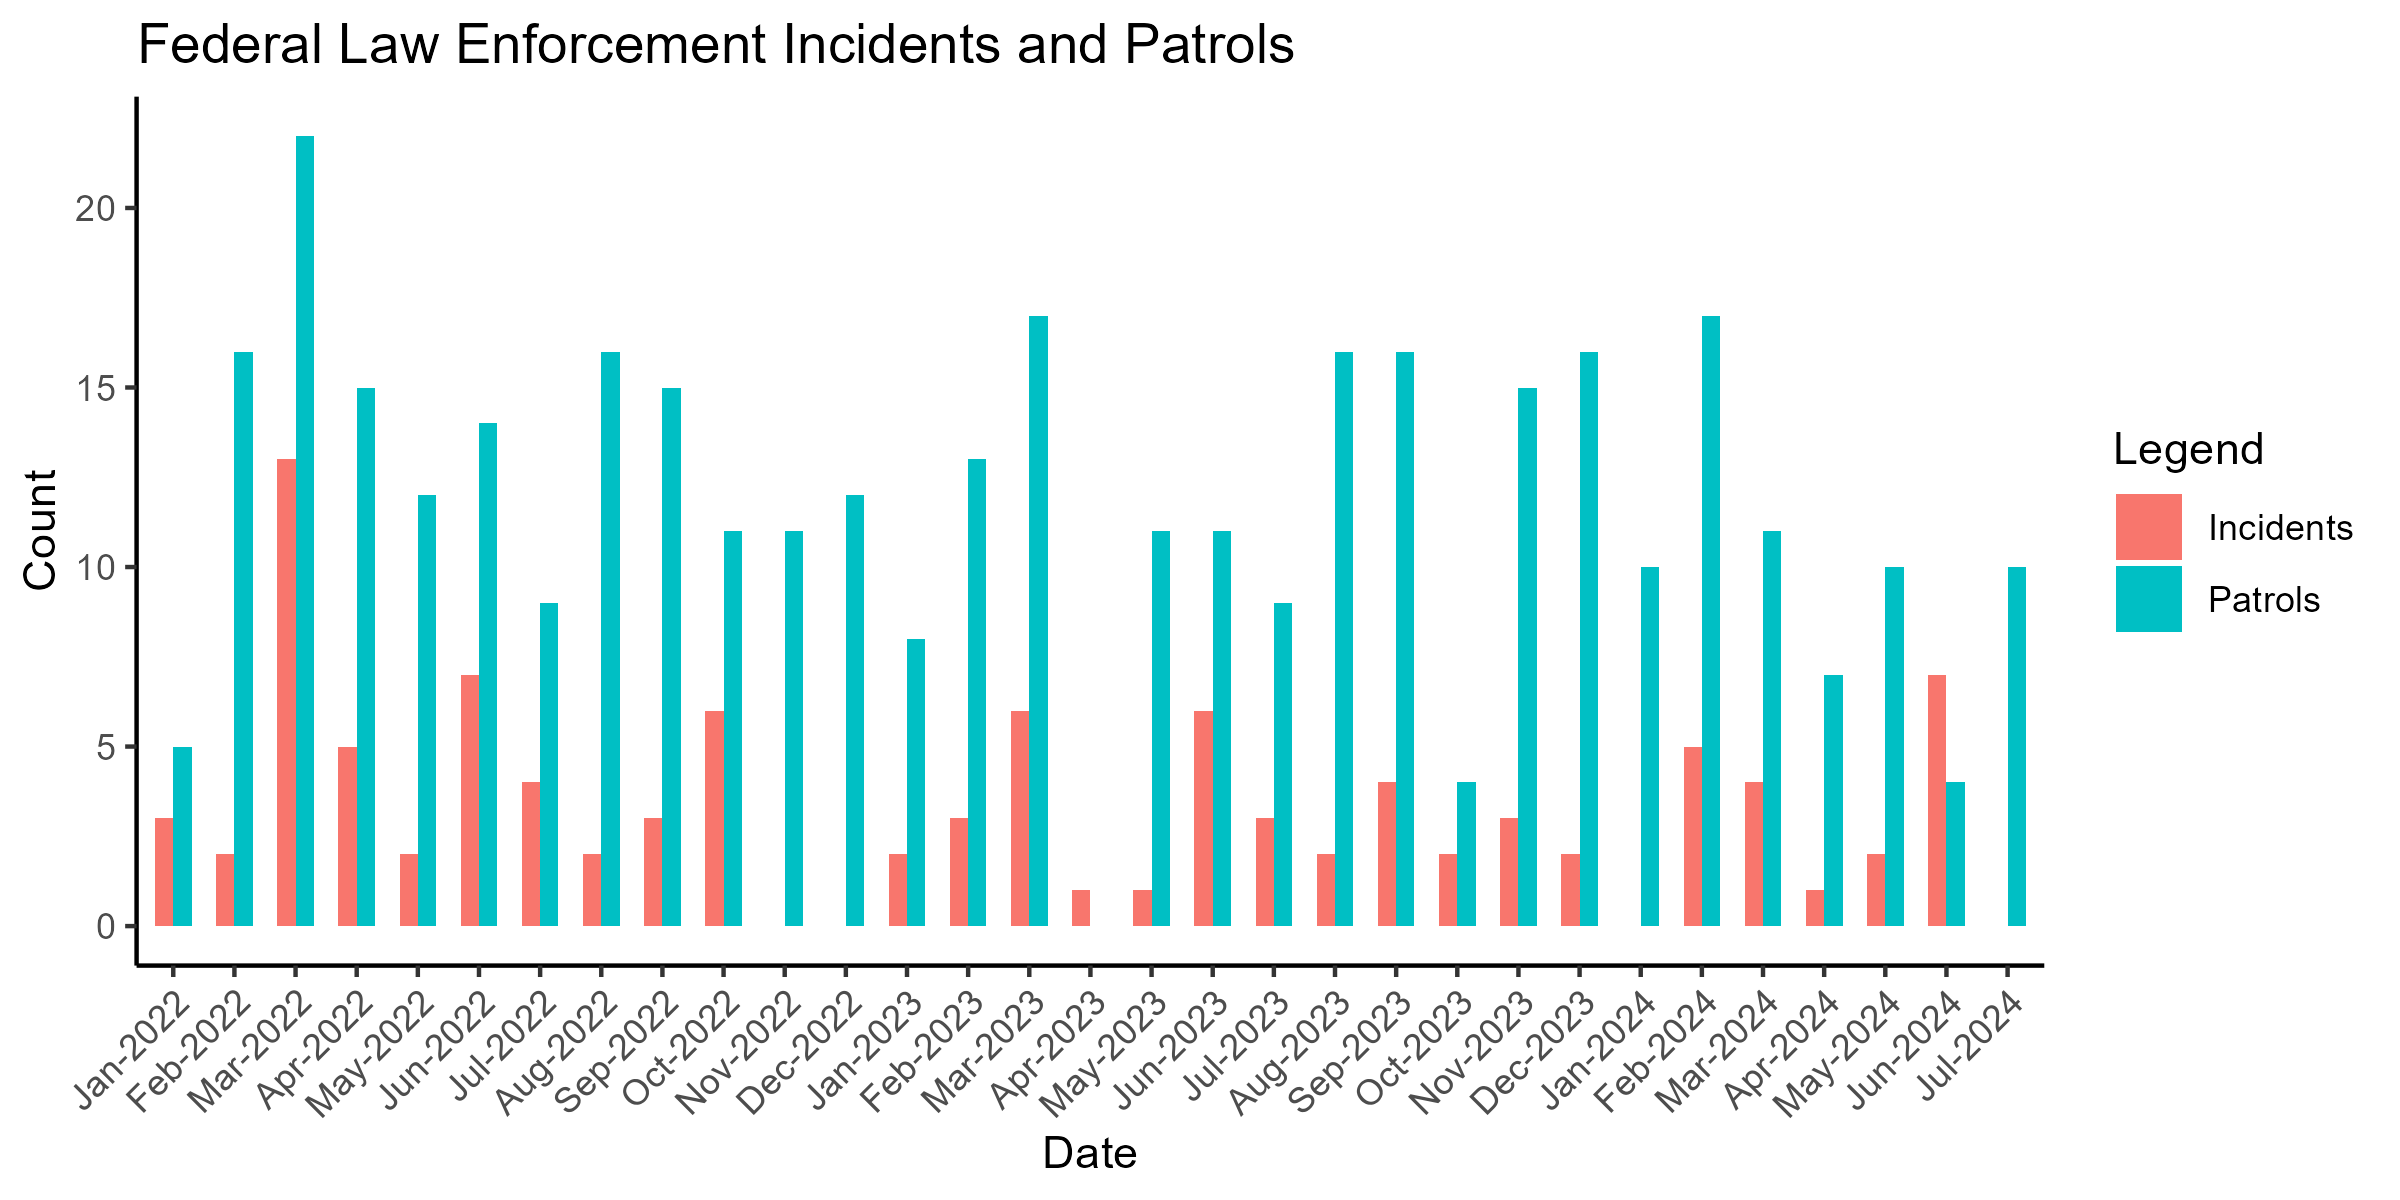
2.6.4 Enforcement actions
The number of recorded law enforcement incidents and patrols may be indicative of changes in availability of law enforcement resources. The majority of incidents in the region are created by two NOAA personnel, in conjunction with multiple state and federal partner agencies. Law enforcement conducts patrols, investigations, outreach and education, and compliance assistance to stakeholders. These cumulative efforts aid in governance of fishery management objectives. Data on federal law enforcement incidents where the investigating officer was from the St. Thomas, USVI or San Juan, PR field offices or the word “Caribbean” was mentioned in the brief synopsis were pulled from the NOAA Office of Law Enforcement NOAA Enforcement Information System (NEIS). Similarly, data on federal patrols conducted from a field office in PR or USVI were available in NEIS. Incidents and enforcement have been fairly stable over the short available time series, with some inter-annual variability (Figure 2.33).
2.7 Protection of ecosystems
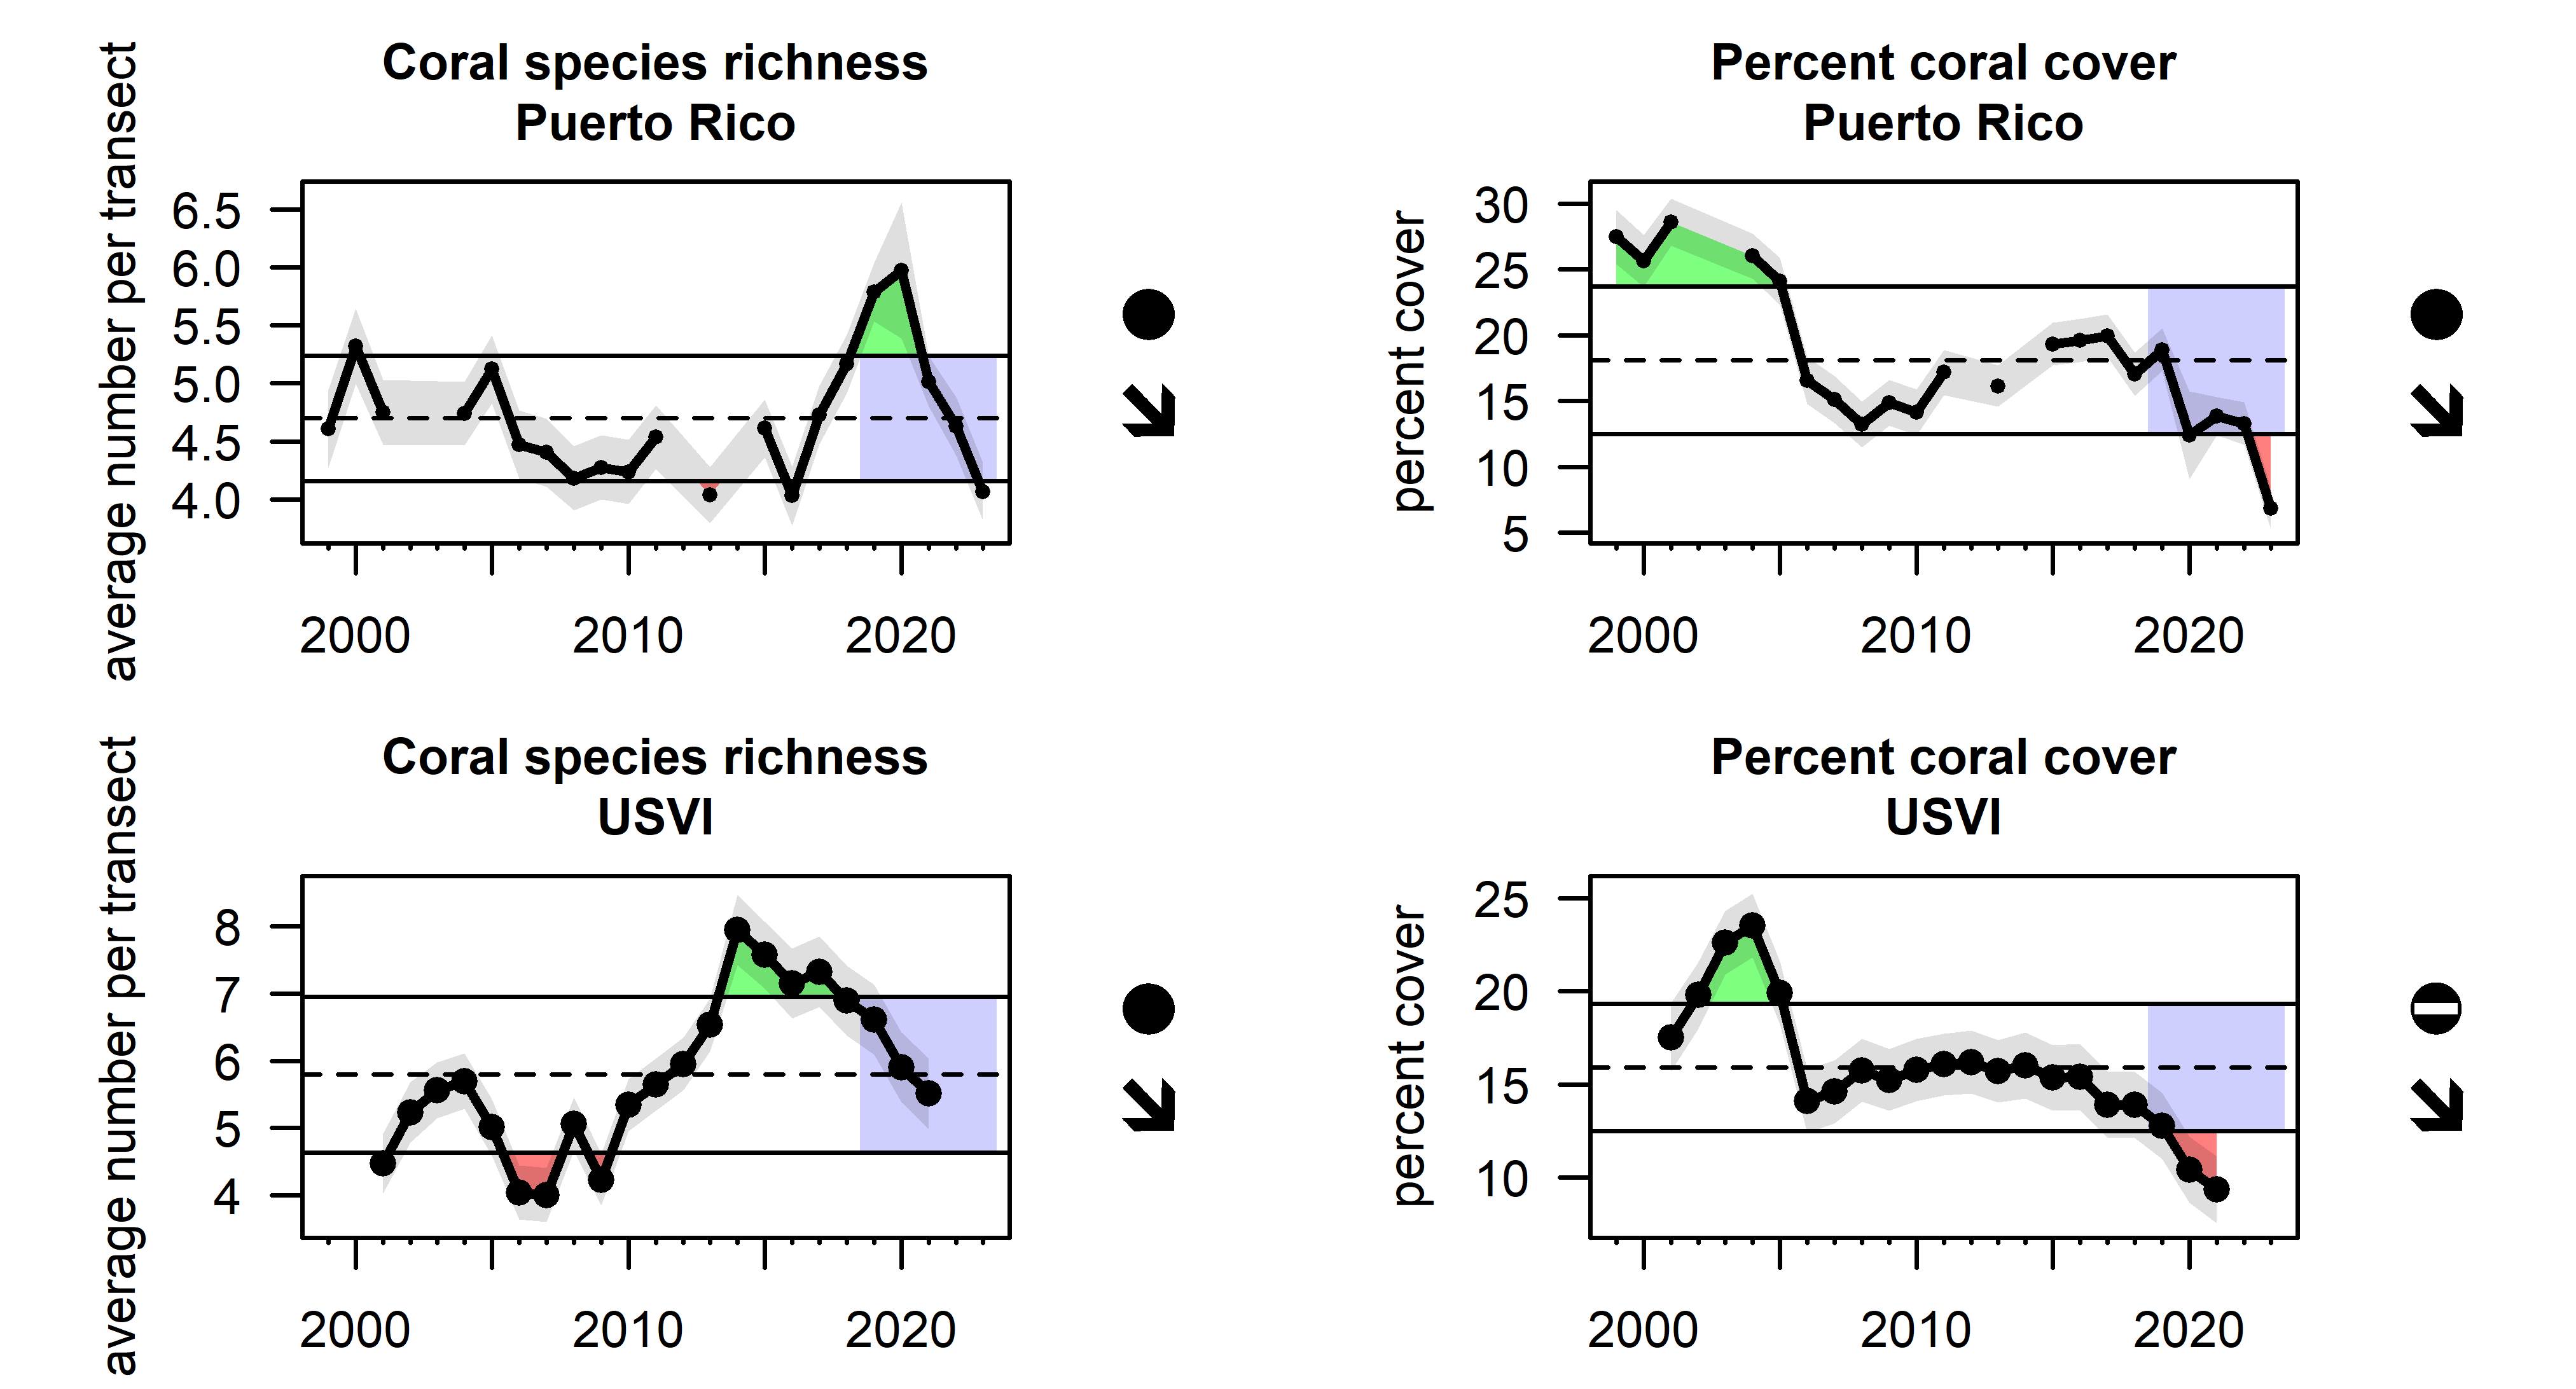
2.7.1 Coral cover and coral species diversity
Coral reef ecosystem integrity is a major concern for stakeholders in the U.S. Caribbean region (Seara et al. 2024). The PRCRMP and TRCMP have measured benthic cover at fixed transects for over two decades, allowing for a comparison over time. Coral species richness was calculated based on the average number of hard coral species per 10-m long transect, and percent coral cover is measured by assigning substrate type to randomly assigned points within still images of the benthic transects (TCRMP) or using the continuous intercept method over a fixed transect line (PRCRMP). Trends in species richness for both Puerto Rico and the USVI fluctuate over time with no clear trend, although there has been a sudden decline in recent years. Percent coral cover has dropped significantly throughout the 25-year time period with large declines occurring in 2005 and 2019, coinciding with major bleaching events (Figure 2.34).