In this section, we report indicators that capture identified risks to the ecosystem that could impact the ability to meet Fishery Management Plan objectives. Unless otherwise specified, physical indicators reported for the U.S. Caribbean region were calculated over a bounding box with limits of longitude 68 degrees W to 64.5 degrees W and latitude 17.5 degrees N to 18.75 degrees N.
Sea surface temperature
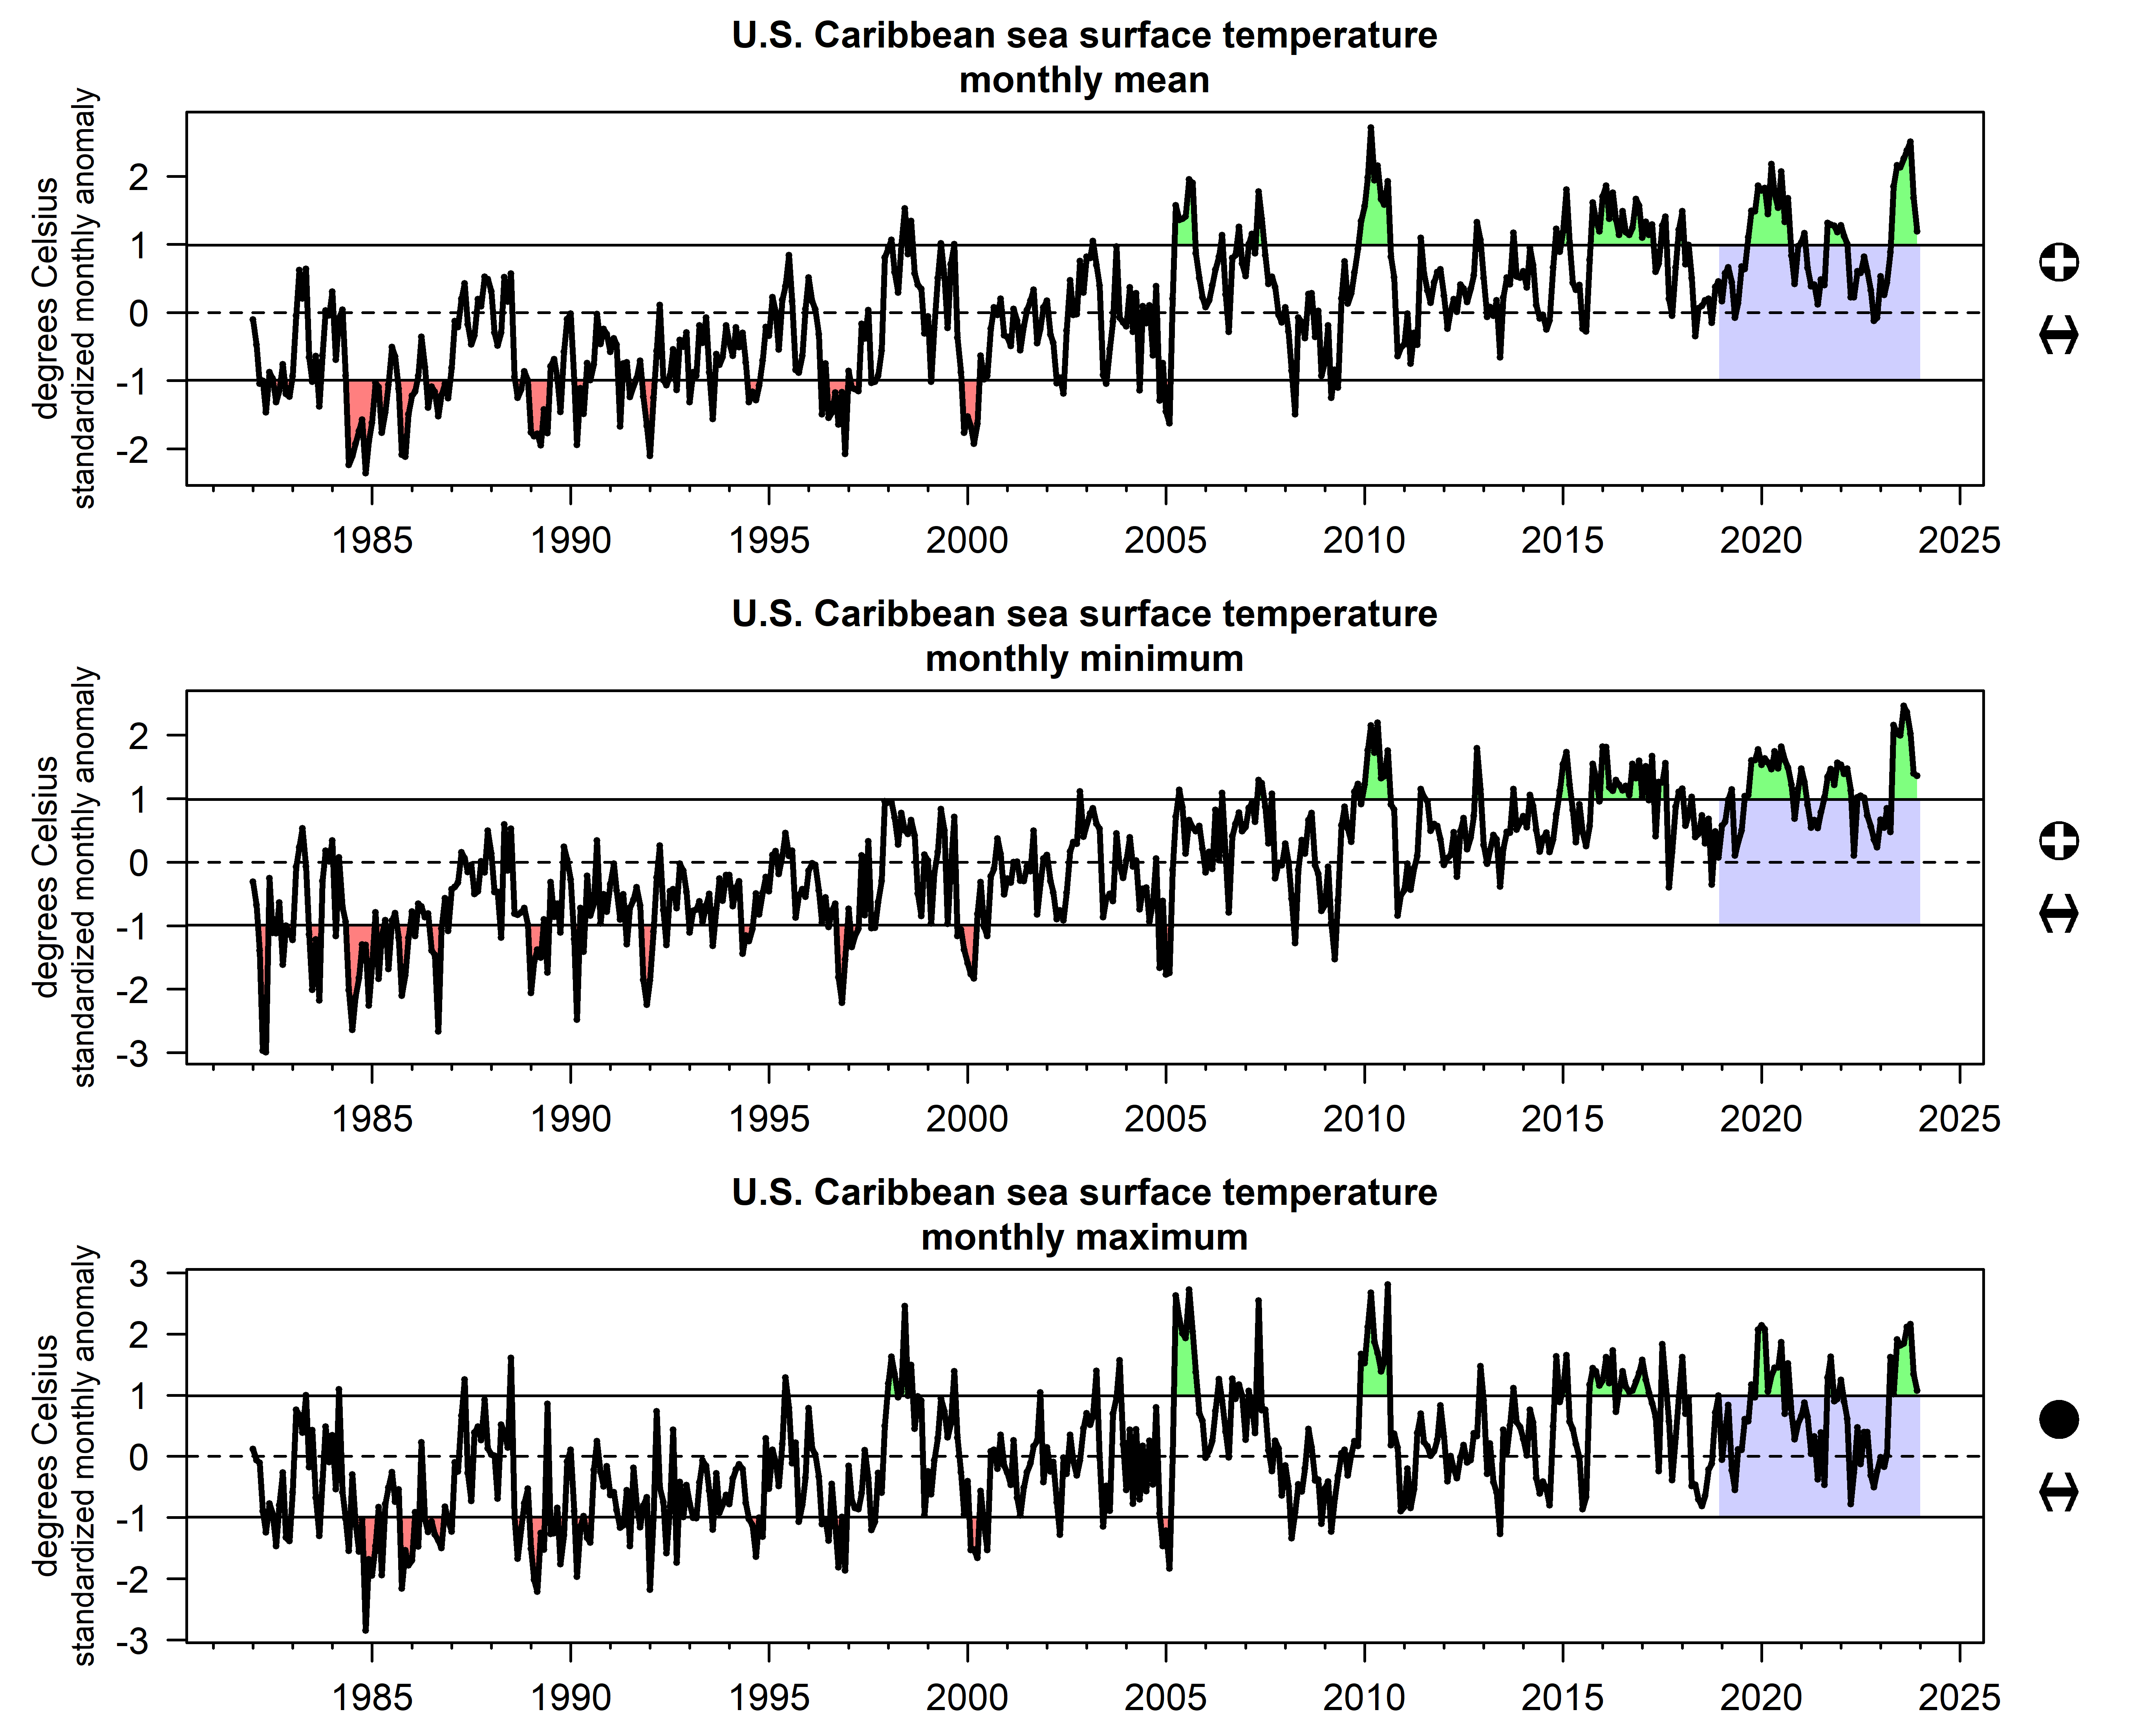
Ocean temperatures affect species distributions and other aspects of population dynamics and have impacts on habitats such as coral reefs. Monthly mean, minimum, and maximum sea surface temperatures were calculated based on the 1/4 Degree Daily Optimum Interpolation Sea Surface Temperature (OISST) Analysis (Reynolds et al. 2007). Mean temperatures in the U.S. Caribbean region have been increasing at an average rate of 0.25 degrees Celsius per decade. In the last several years, monthly mean, monthly minimum, and monthly maximum temperatures have all been well above the historical average, and in the last five years the temperature trend has been a significant increase (Figure 3.1).
Coral bleaching stress
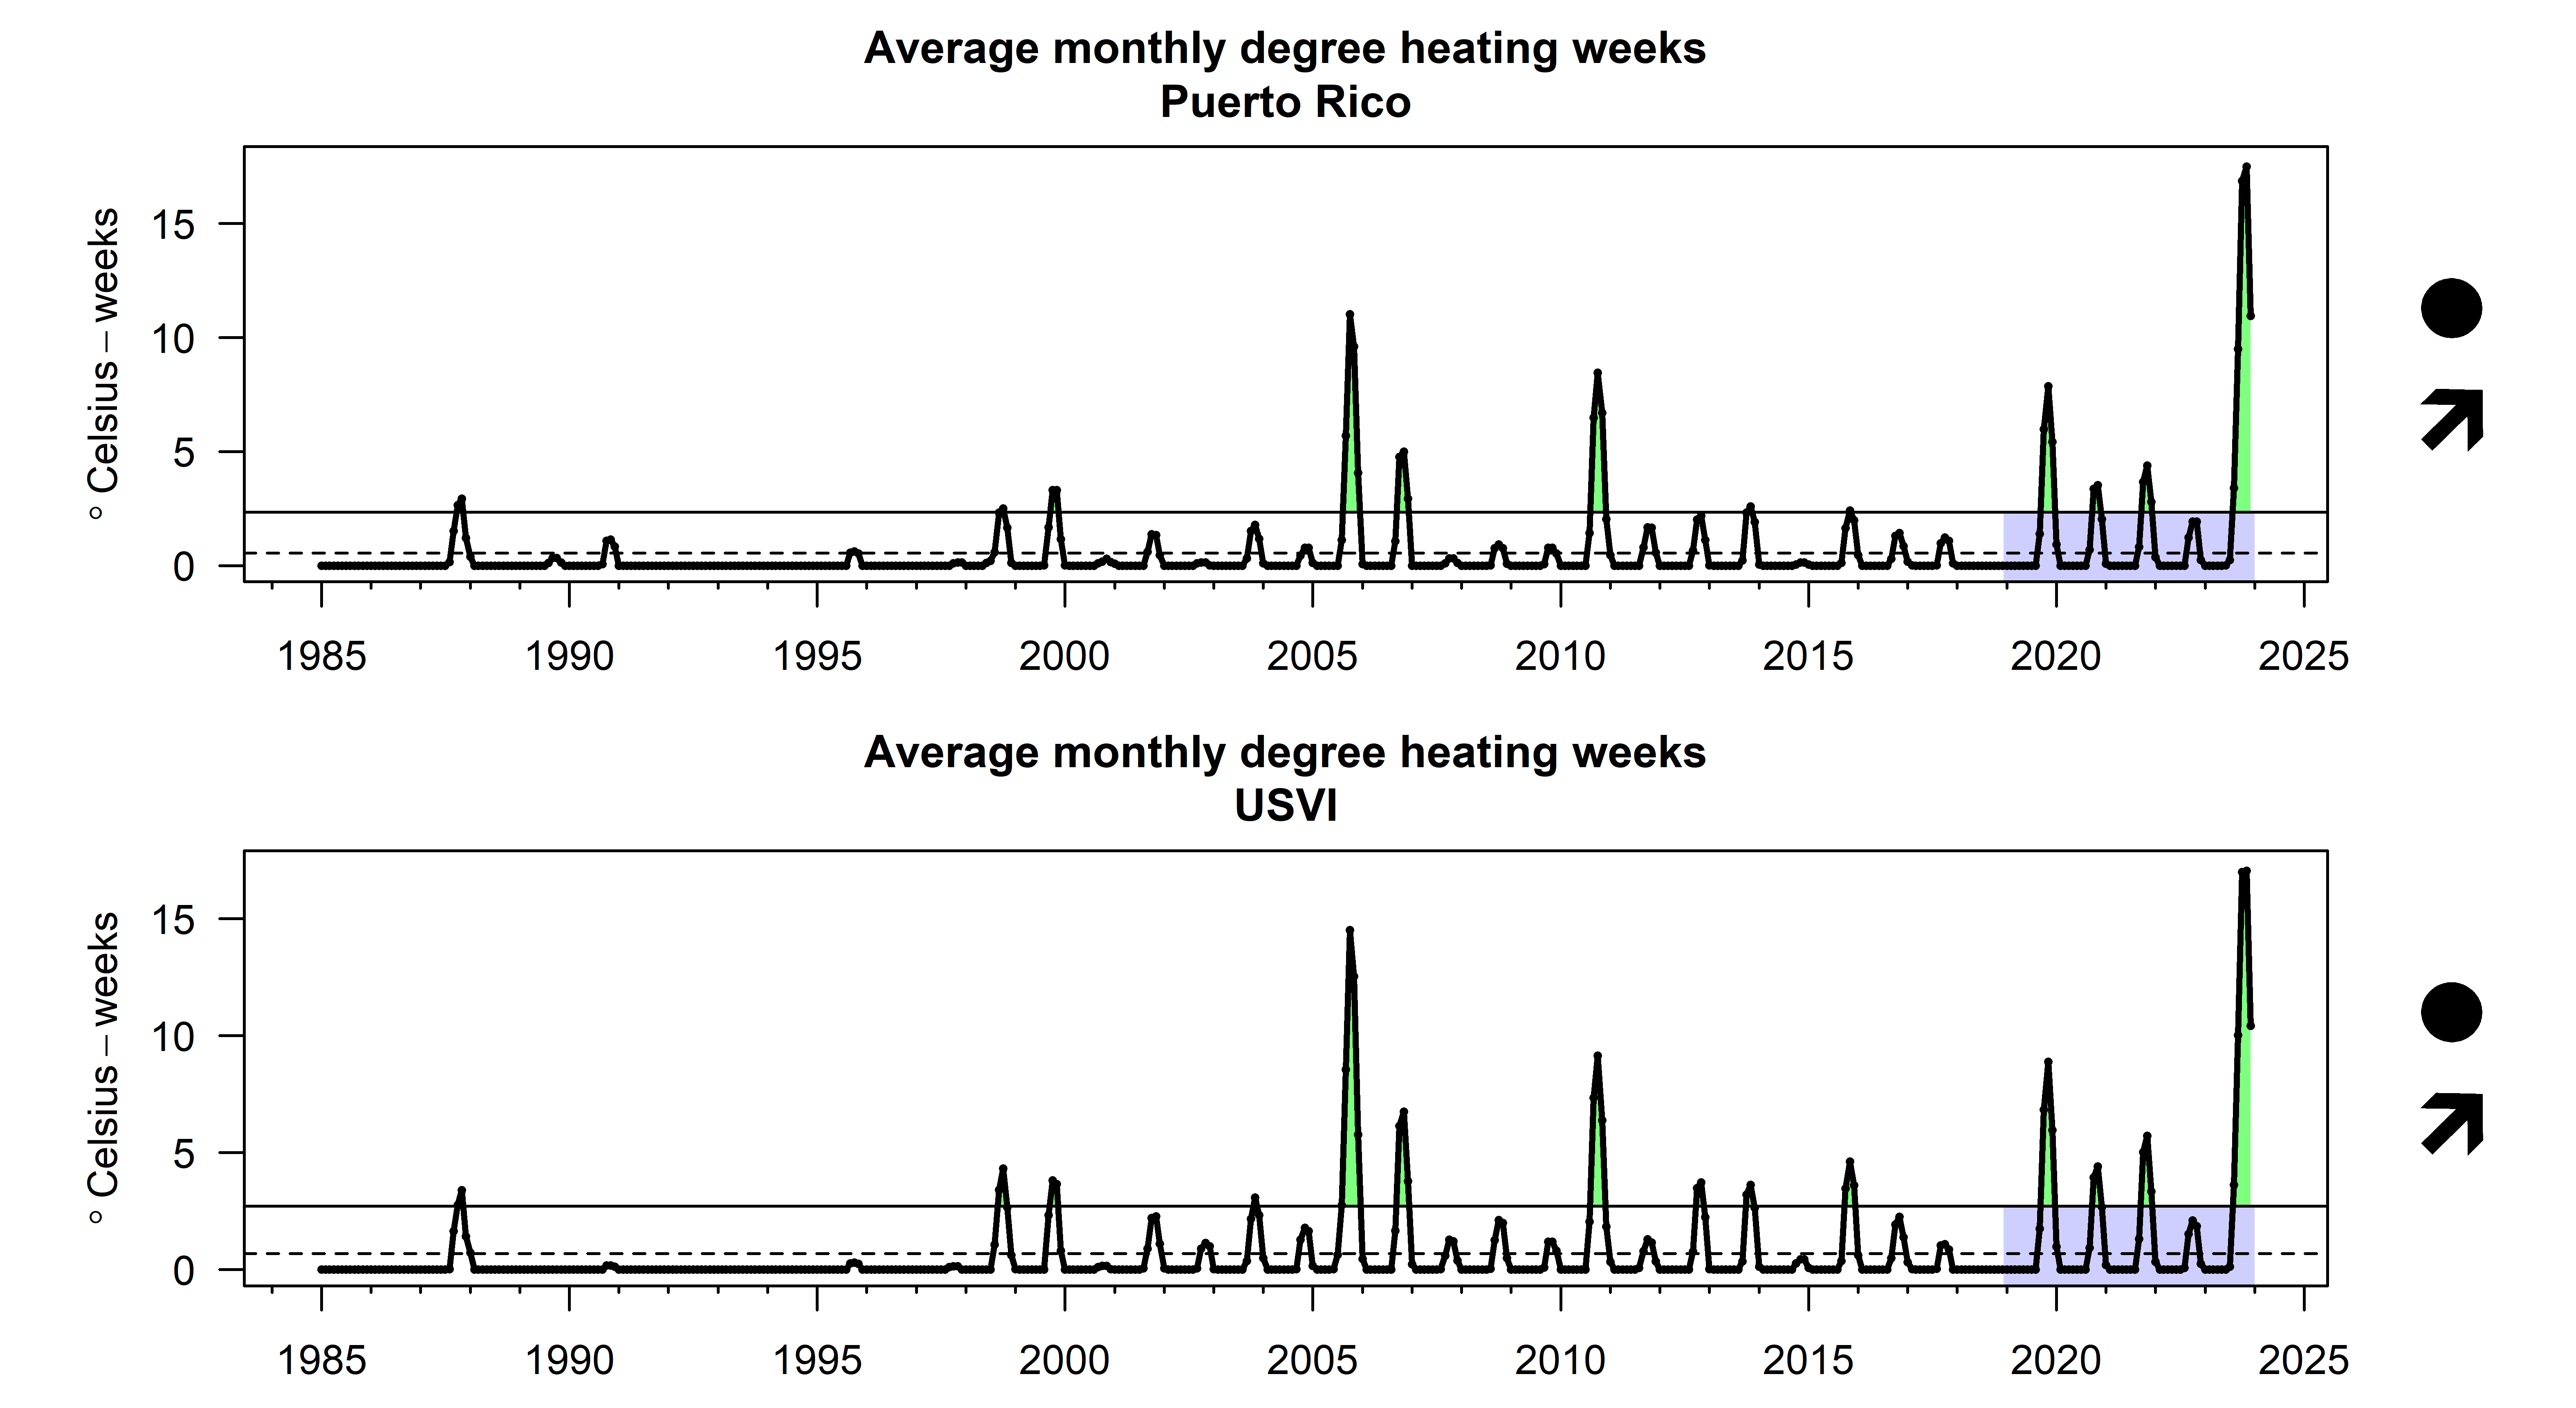
Accumulated heat stress, which can lead to coral bleaching and death, is measured by summing degree heating weeks for the previous 12-week period from sea surface temperature data (NOAA Coral Reef Watch 2019). Bleaching stress was generally below average prior to the mid-2000s, when a sudden bleaching event occurred in 2005; this event is now the third most severe event in the time series. In 2024, a bleaching event of unprecedented severity occurred across the U.S. Caribbean and beyond (Figure 3.2).
Ocean acidification
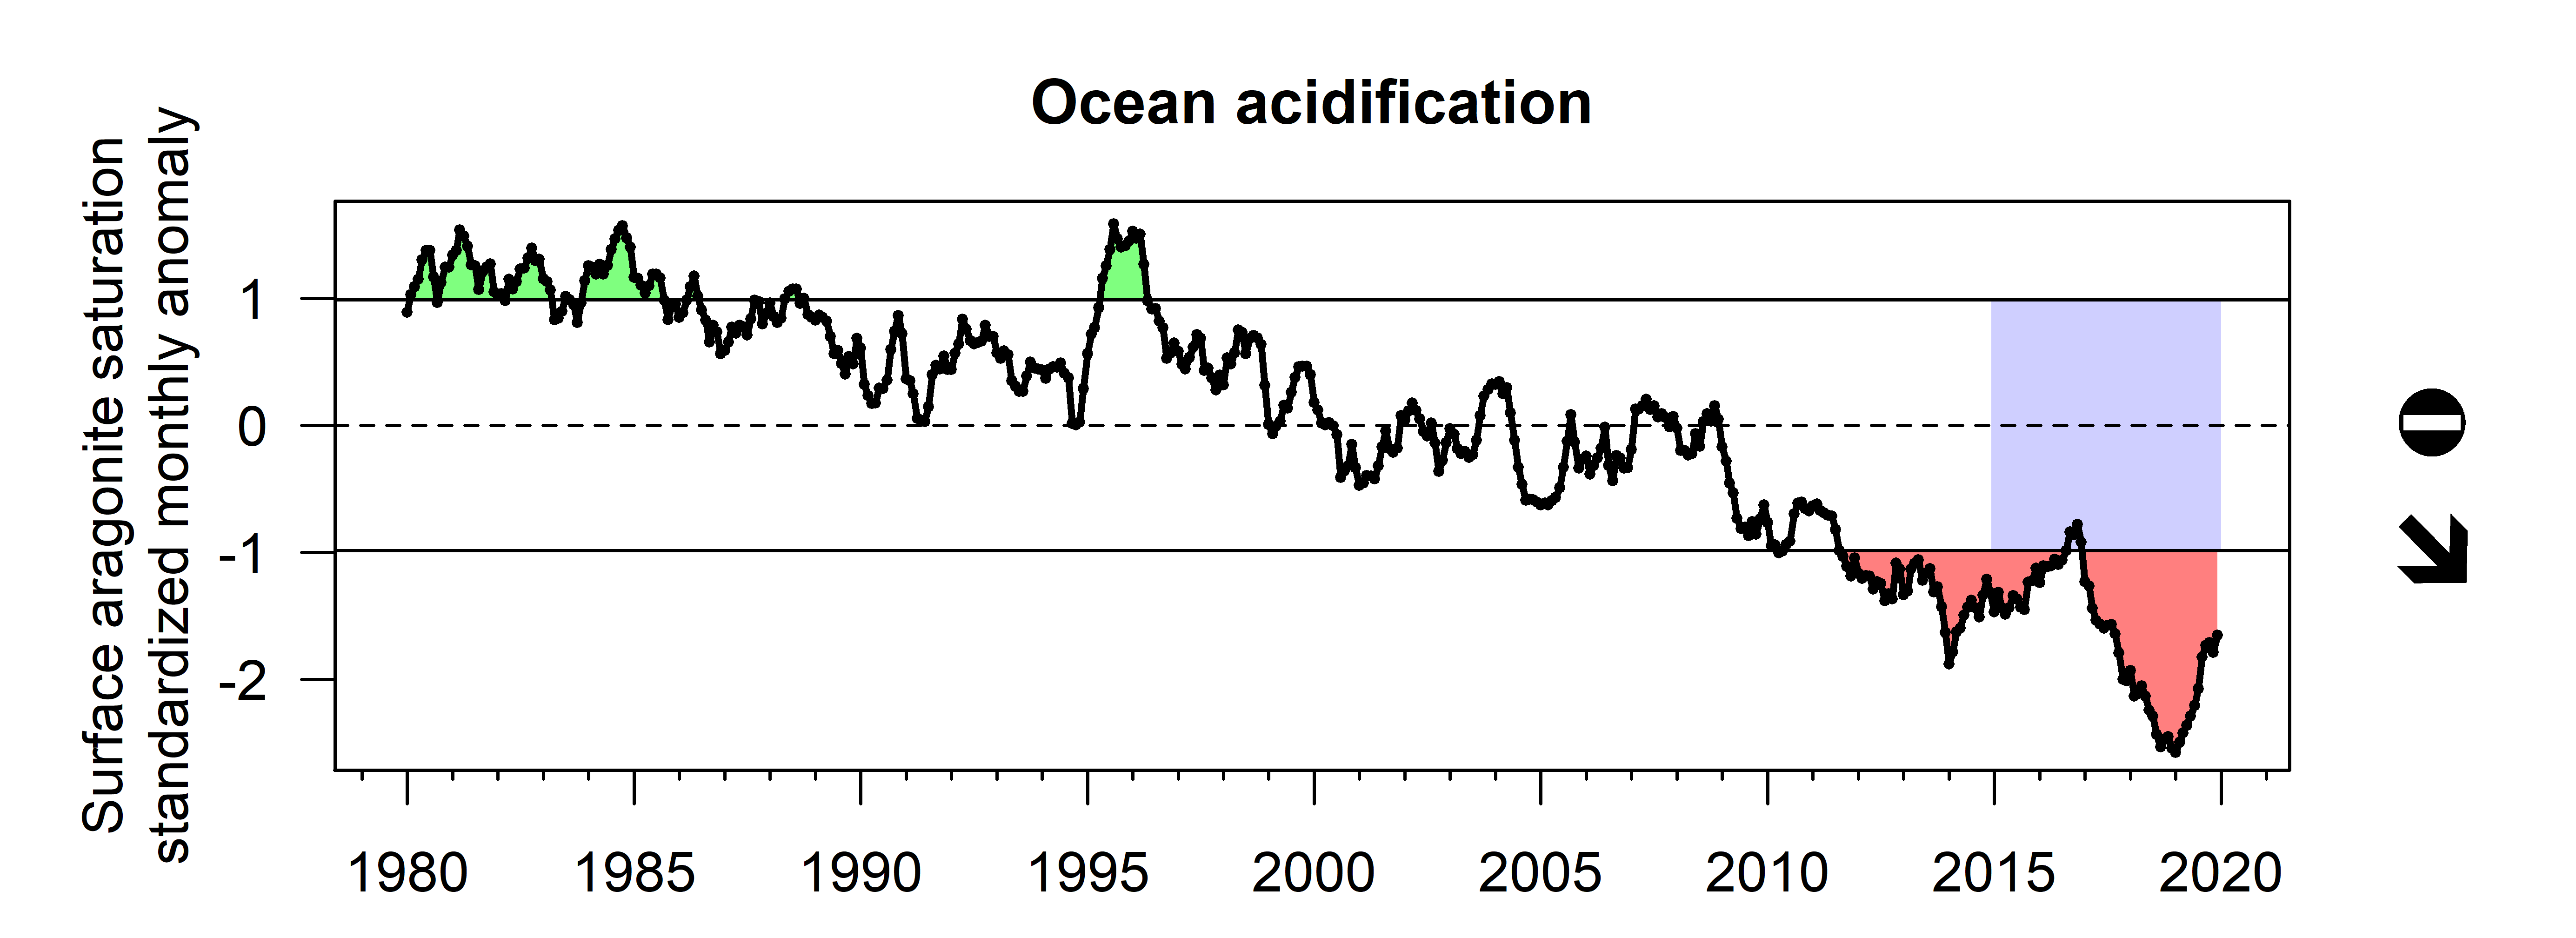
Ocean and coastal acidification can impact organisms directly or indirectly; a decrease in aragonite saturation state can make it difficult for corals and other calcifying organisms to form hard structures, contributing to lower reproduction or survival rates. When the aragonite saturation state falls below 3, corals begin to experience physiological stress, and calcification rates decline and skeletal structure begins to weaken; calcification stops completely and skeletal structure begins to dissolve at aragonite saturation states below 1 (Andersson et al. 2009). In-situ measurements of aragonite saturation states are scarce, and a synoptic long-term view is only available from modeled products. Aragonite saturation state was derived for the U.S. Caribbean region from the MOM-TOPAZ hindcast (Gomez and Lee 2023). An overall negative trend occurs, with an acceleration of this trend apparent after 2008 (Figure 3.3).
Hurricane activity
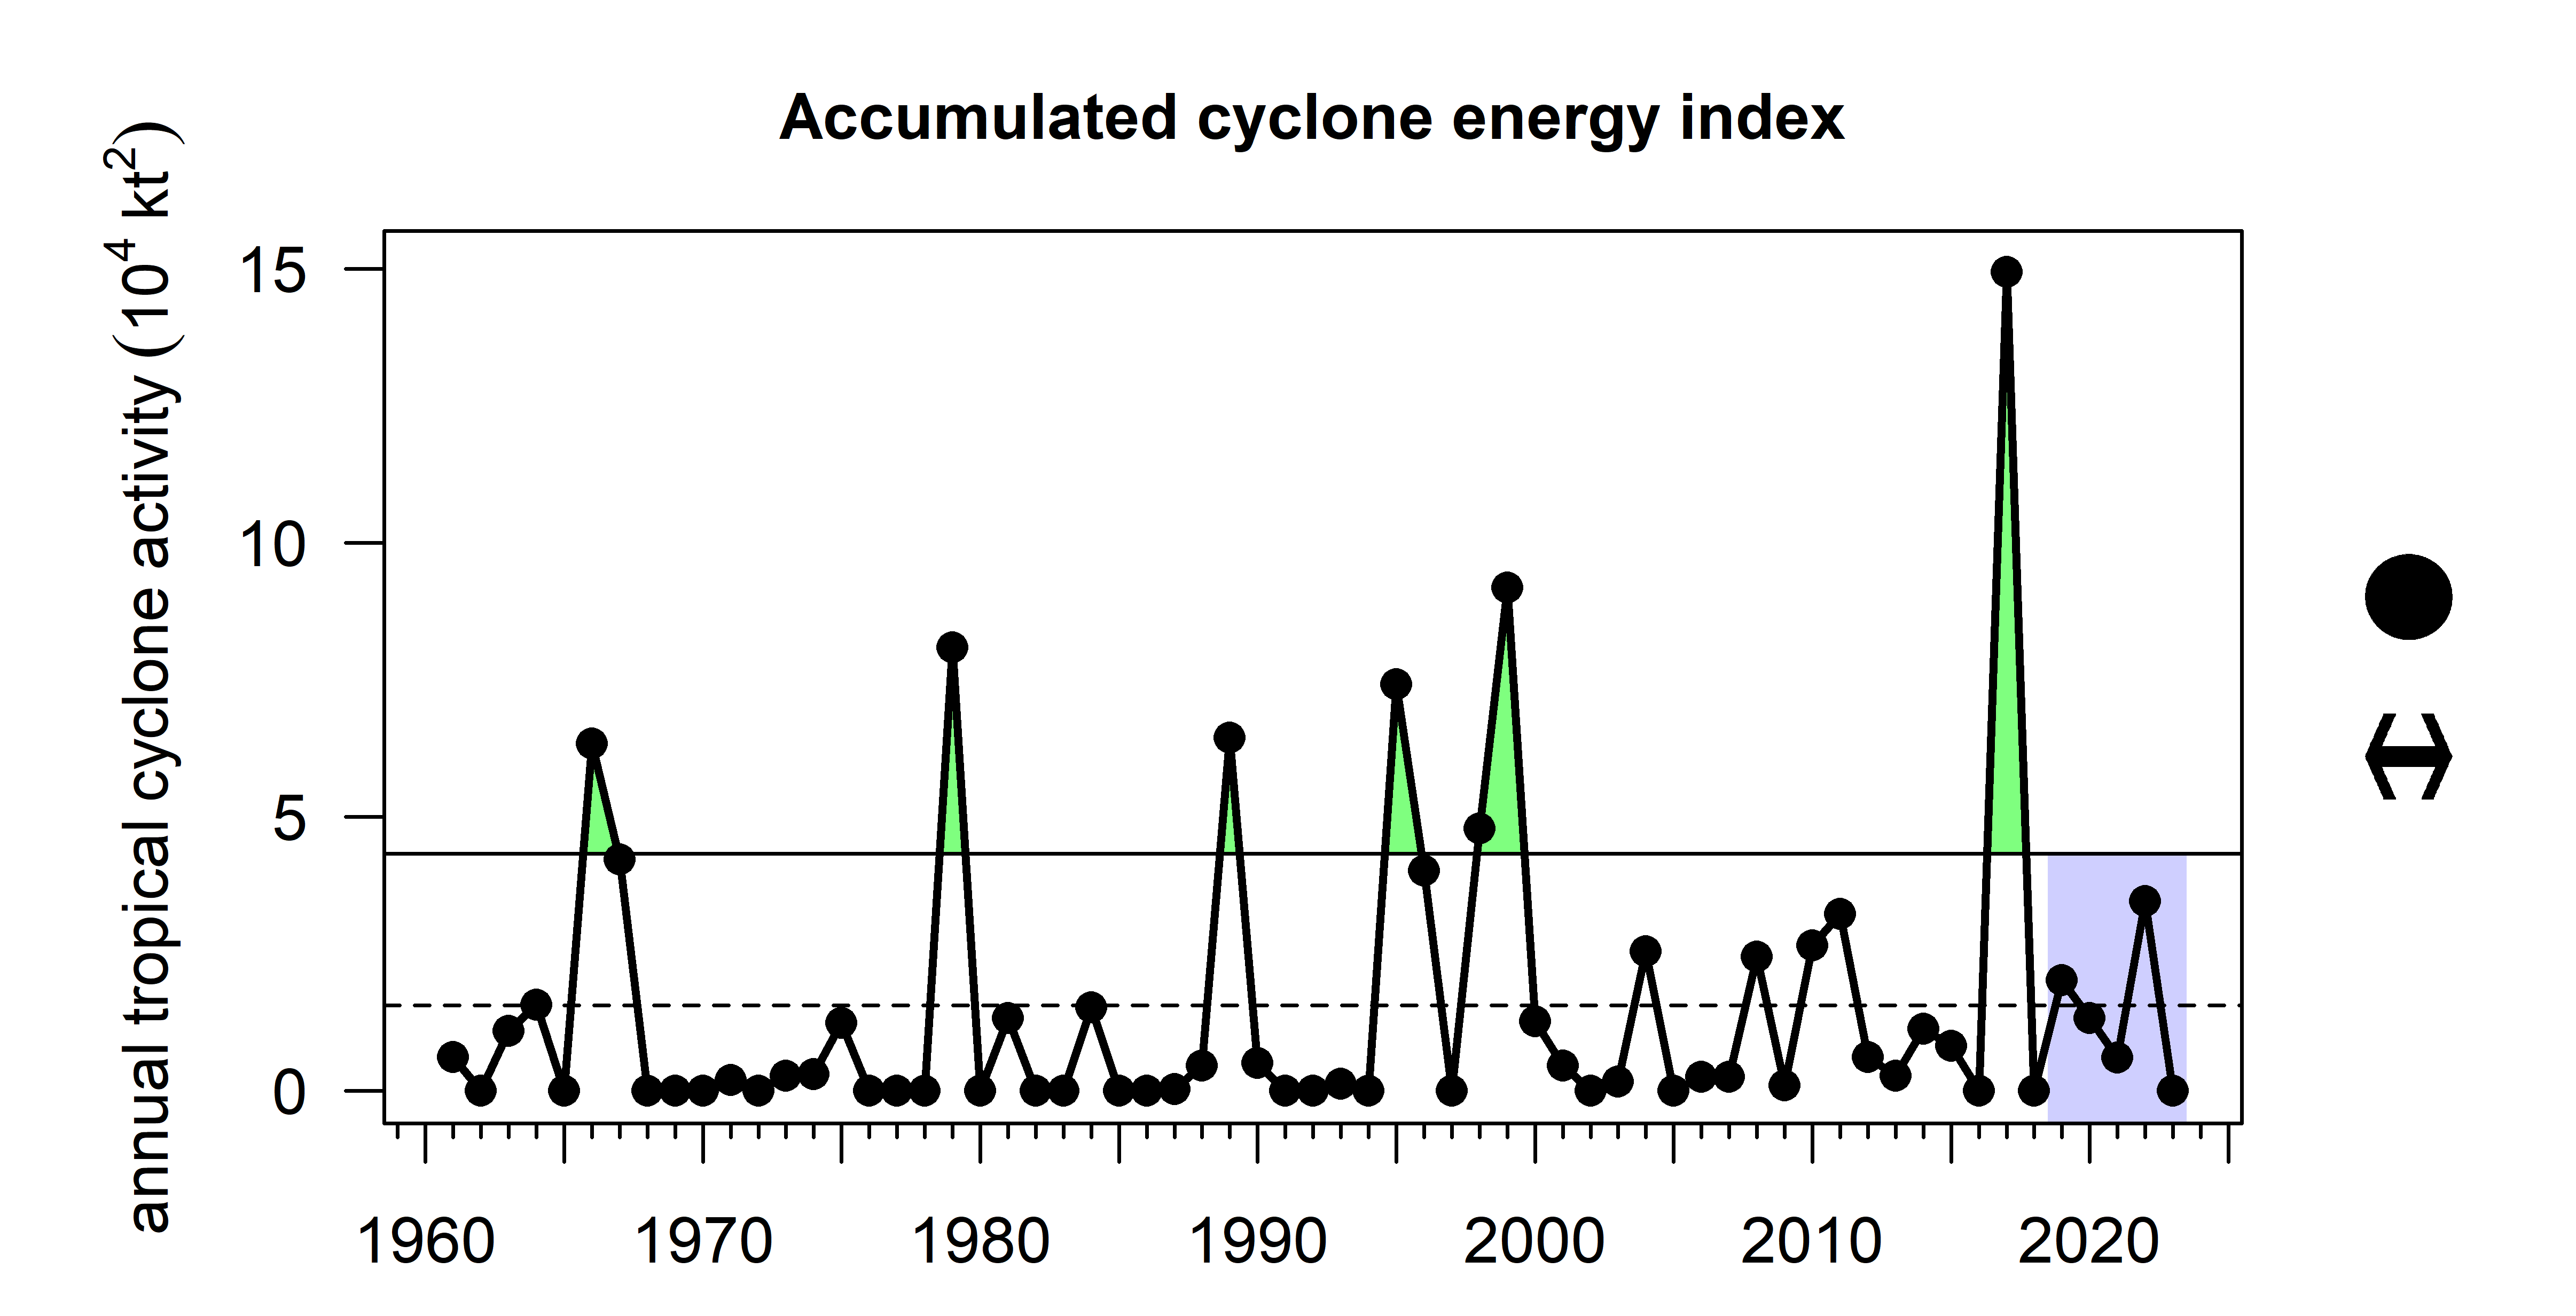
Hurricane activity can be captured by the accumulated cyclone energy (ACE) index, a measure of overall tropical cyclone activity measured as the sum of squared wind speeds. The ACE index was calculated for storms that track within the U.S. Caribbean region as documented by the International Best Track Archive for Climate Stewardship database (Knapp et al. 2010). The index has fluctuated throughout the past seven decades, with multiple notable peaks (Figure 3.4). During the year 2017, hurricane activity was at an unprecedented high, due to two major hurricanes that struck the islands: Irma and Maria.
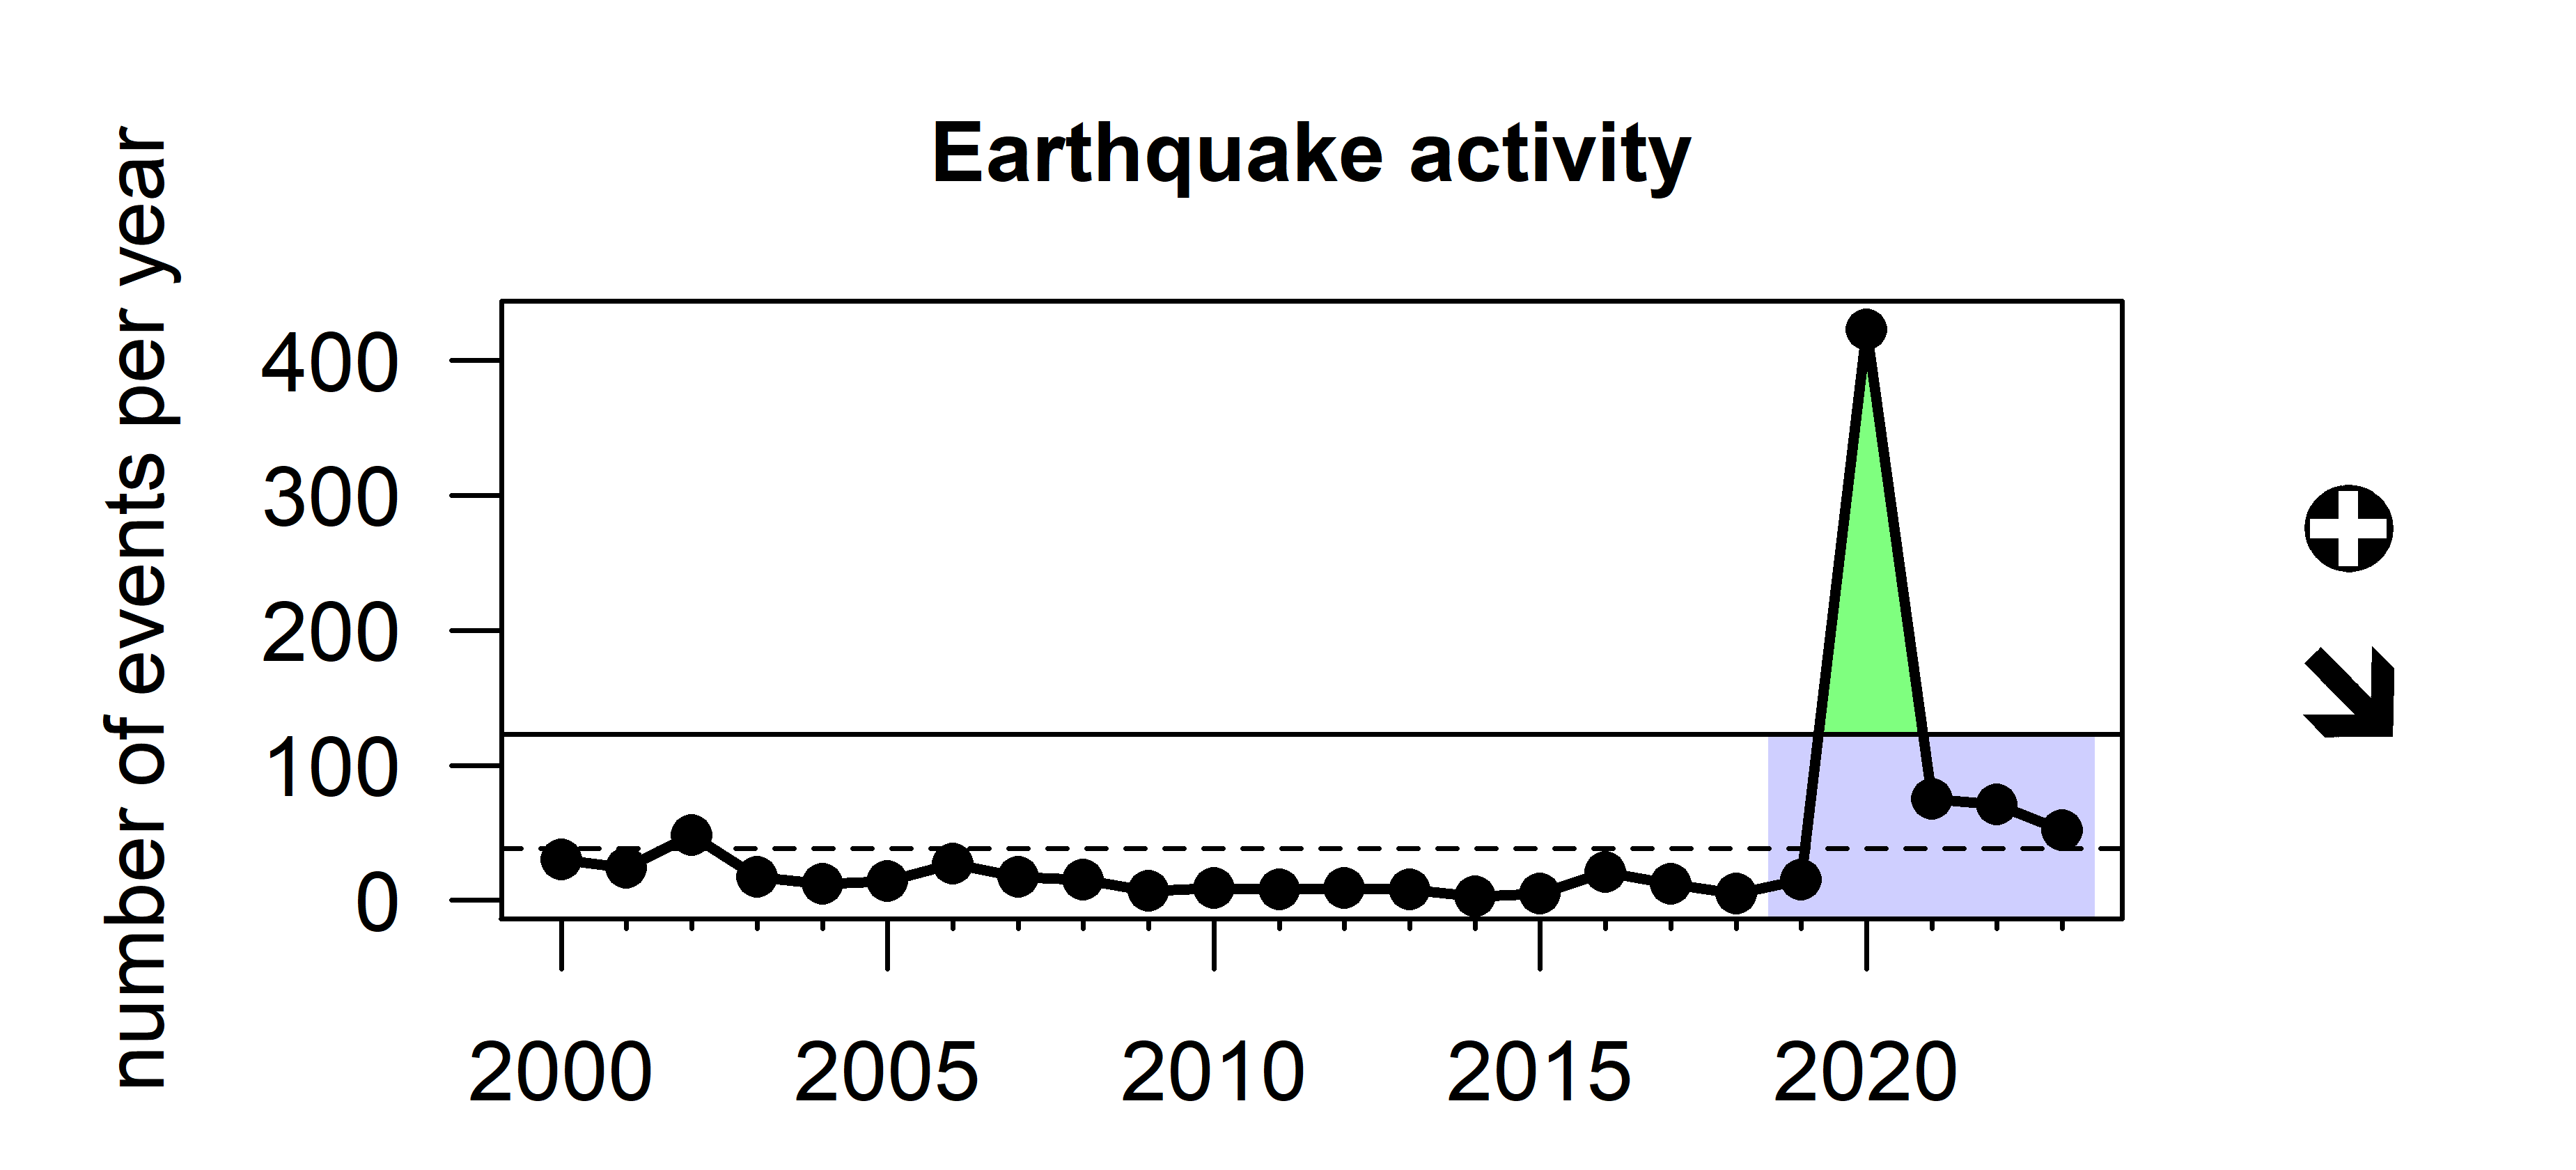
Earthquake activity
Earthquakes can induce landslides and cause impacts to infrastructure including homes and the electrical grid, and can be a source of stress in the affected human population (Agar et al. 2022). Individual seismic events are reported by the United States Geological Survey (USGS) in near real-time (Sumy, Welti, and Hubenthal 2020). A major earthquake swarm occurred in Southwest Puerto Rico in early 2020; in this year there were over 400 events of greater than 3.5 magnitude on the Richter scale (Figure 3.5).
Point source pollution
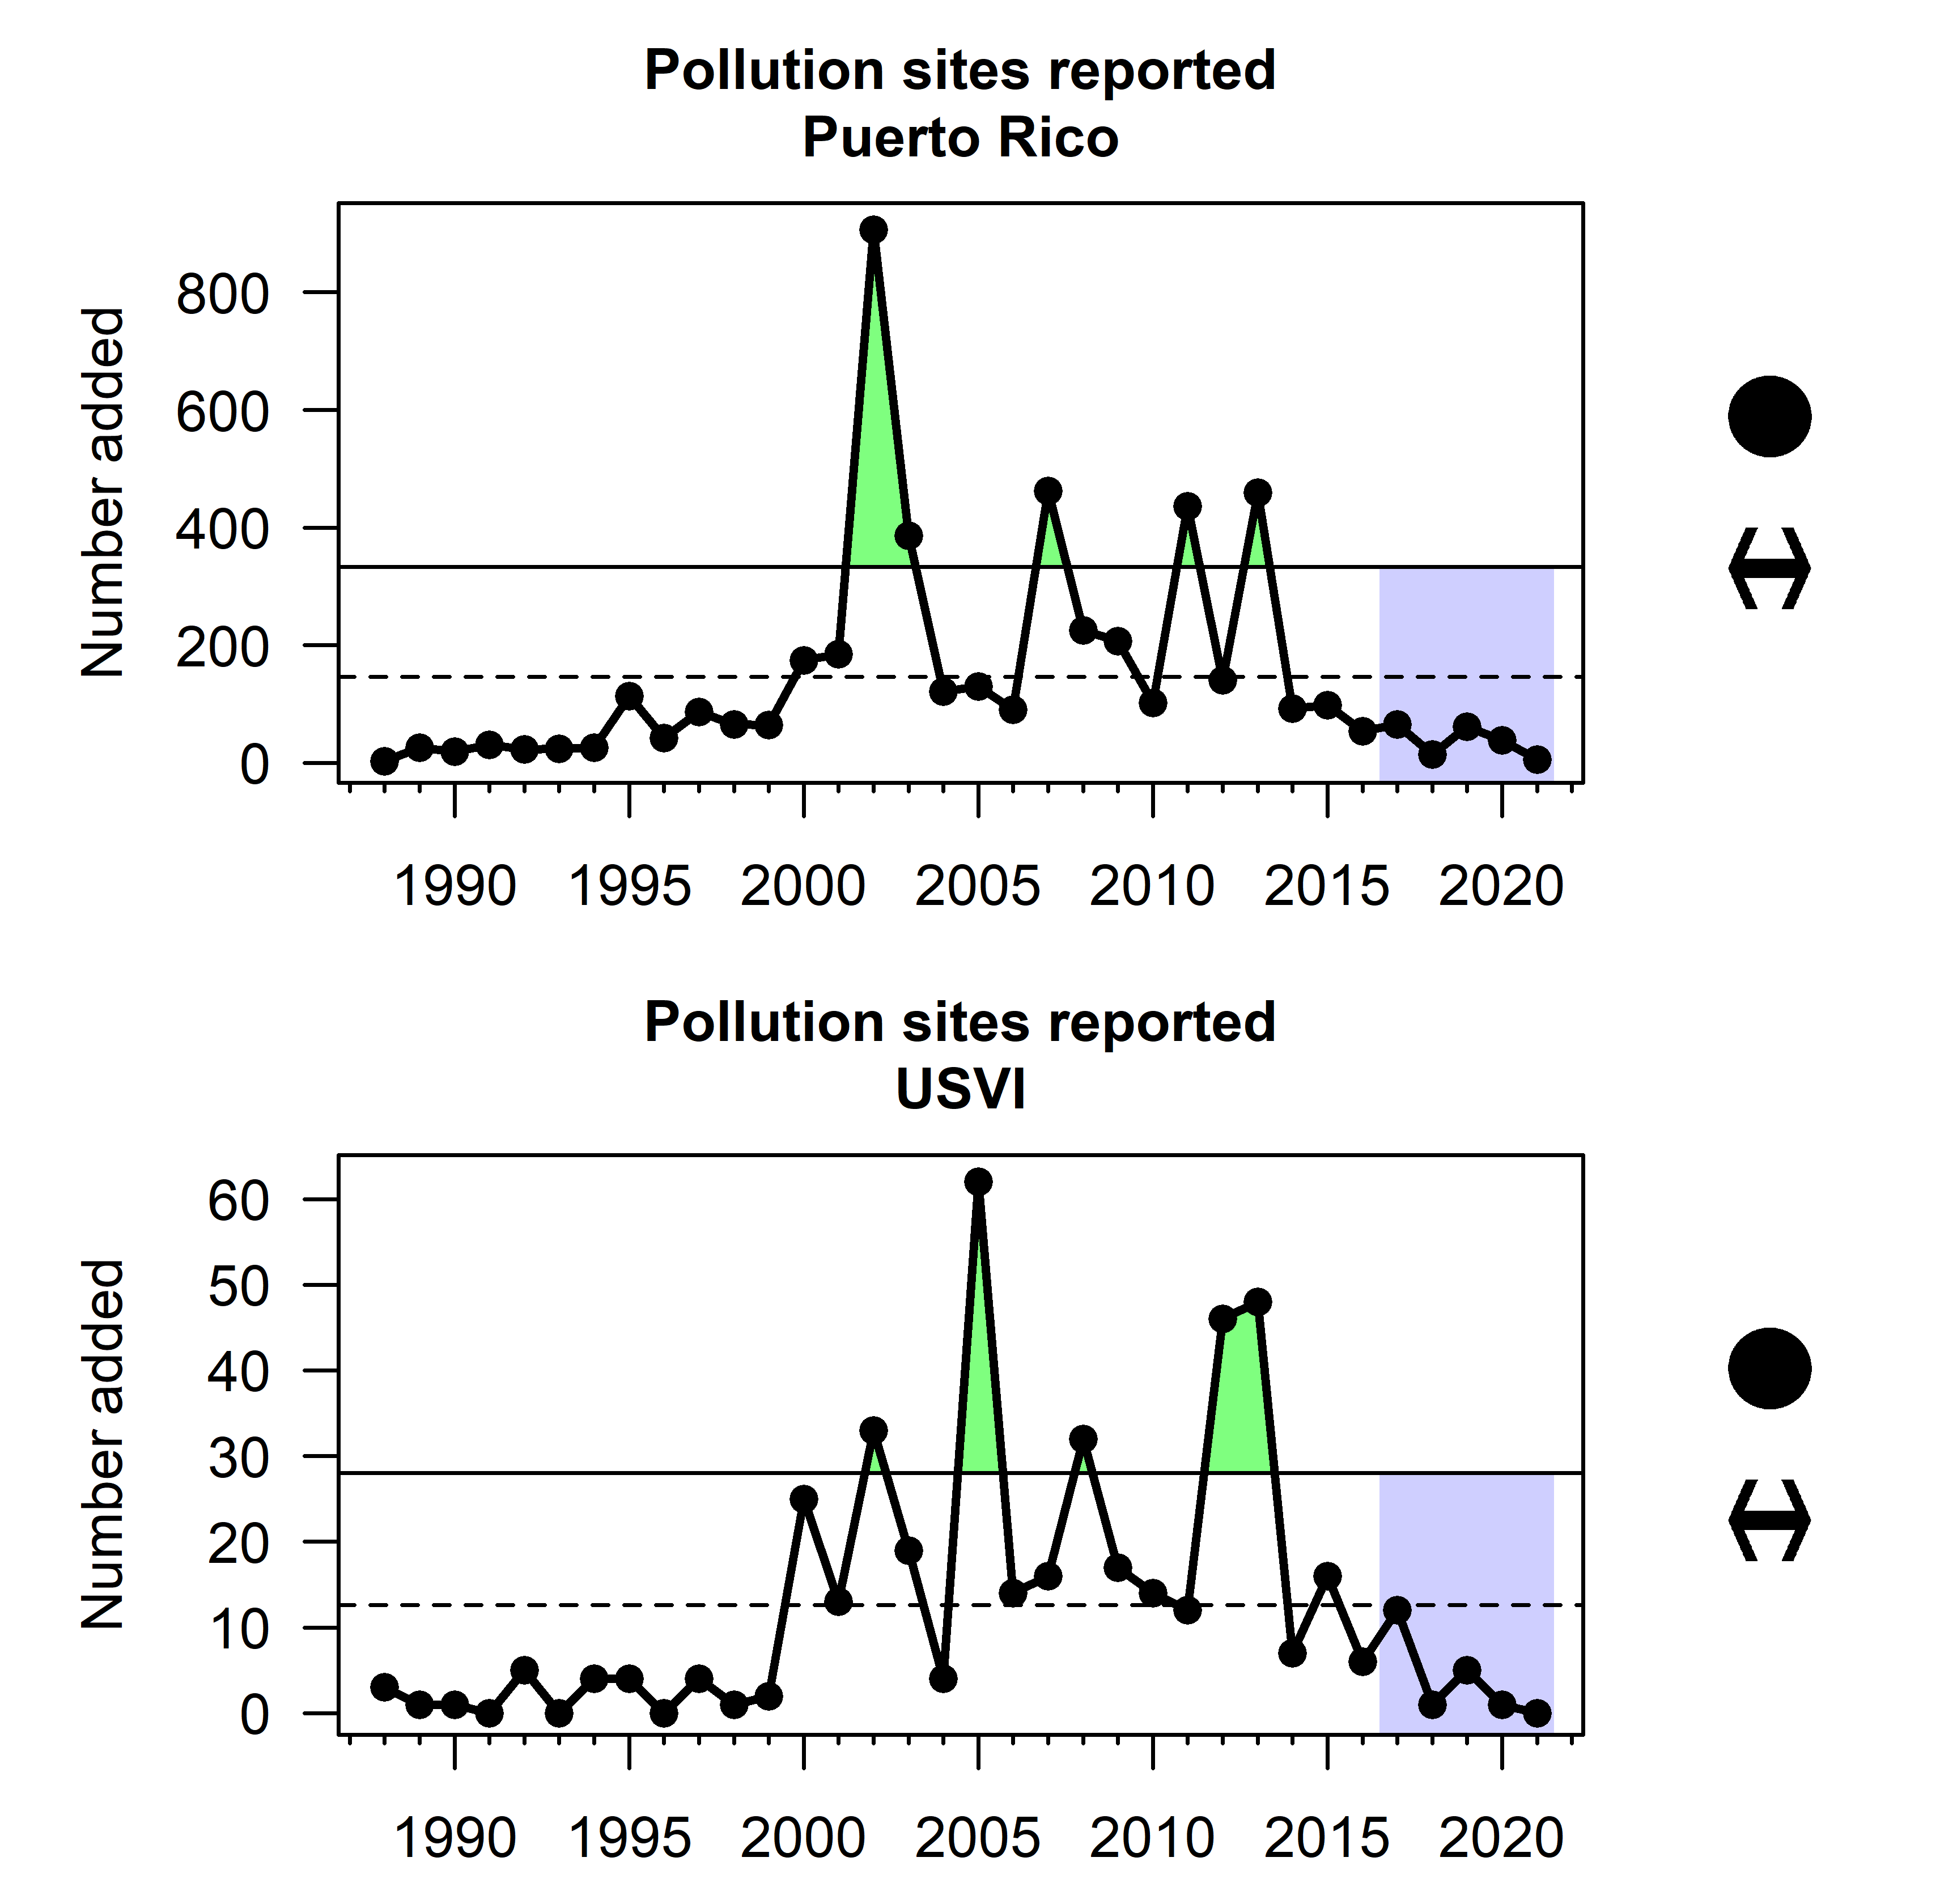
Impacts from terrestrial pollution can be captured from several databases maintained by the Environmental Protection Agency (EPA). These databases provide information on companies that have been issued permits to discharge wastewater into rivers, on the release of toxic chemicals and waste management activities at facilities, and on sites declared through the Comprehensive Environmental Response, Compensation, and Liability Act (commonly known as Superfund sites). The number of pollution sites reported increased in the 2000s, but has decreased slightly in both Puerto Rico and USVI in recent years (Figure 3.6). Note that this indicator does not represent the timing of when pollution was impacting the ecosystem, but rather the timing of investigation and registration in EPA’s monitoring program or attention to the environmental impacts of pollution.
Turbidity
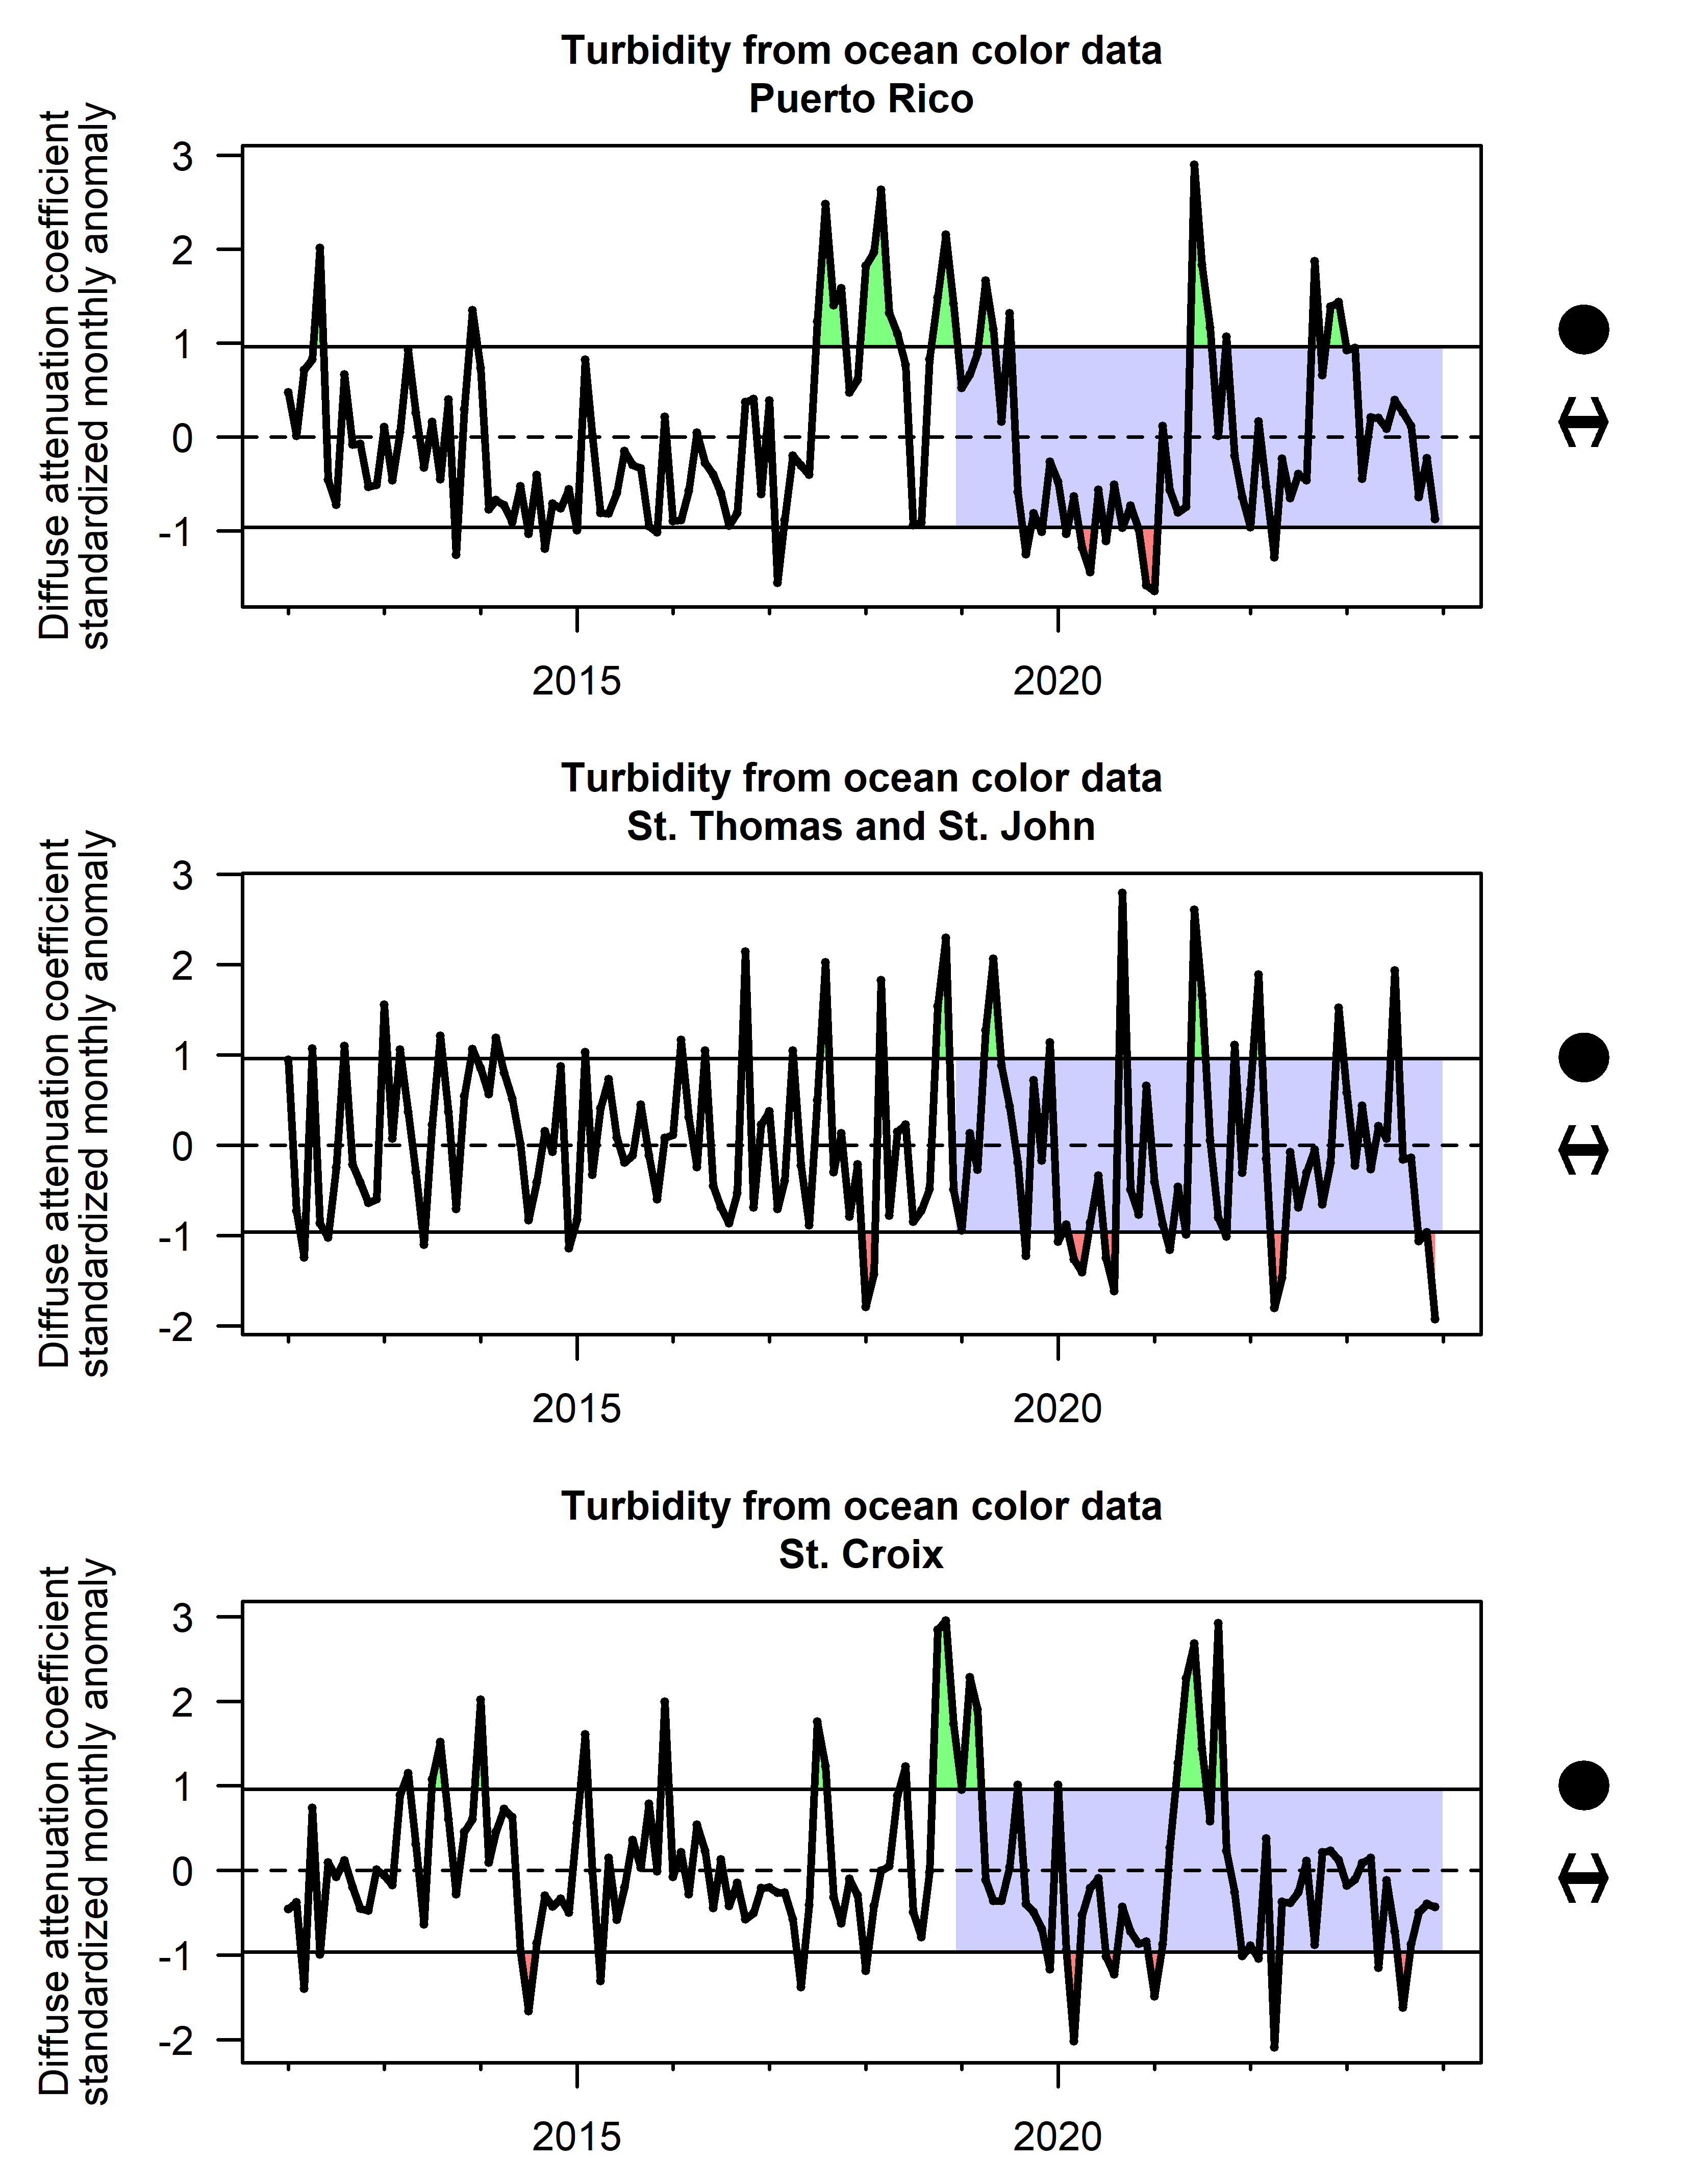
Coastal pollution, runoff, and water quality issues are of major concern to fishing-dependent communities in the U.S. Caribbean (Seara et al. 2024). Water clarity can be measured by the diffuse attenuation coefficient, which indicates how strongly light intensity is attenuated within the water column; however, satellite sensors cannot differentiate between organic and inorganic water particles contributing to water clarity. NOAA’s Coastwatch program provides estimates of the attenuation coefficient for penetration of light at 490nm (Menghua Wang, Son, and Harding Jr. 2009) based on multiple satellite sensors. No overall trend is apparent in any of the U.S. Caribbean islands, although there is increasing variability in turbidity values over time. Elevated anomalies in Puerto Rico in the year 2017 are likely due to hurricane activity.
Water quality
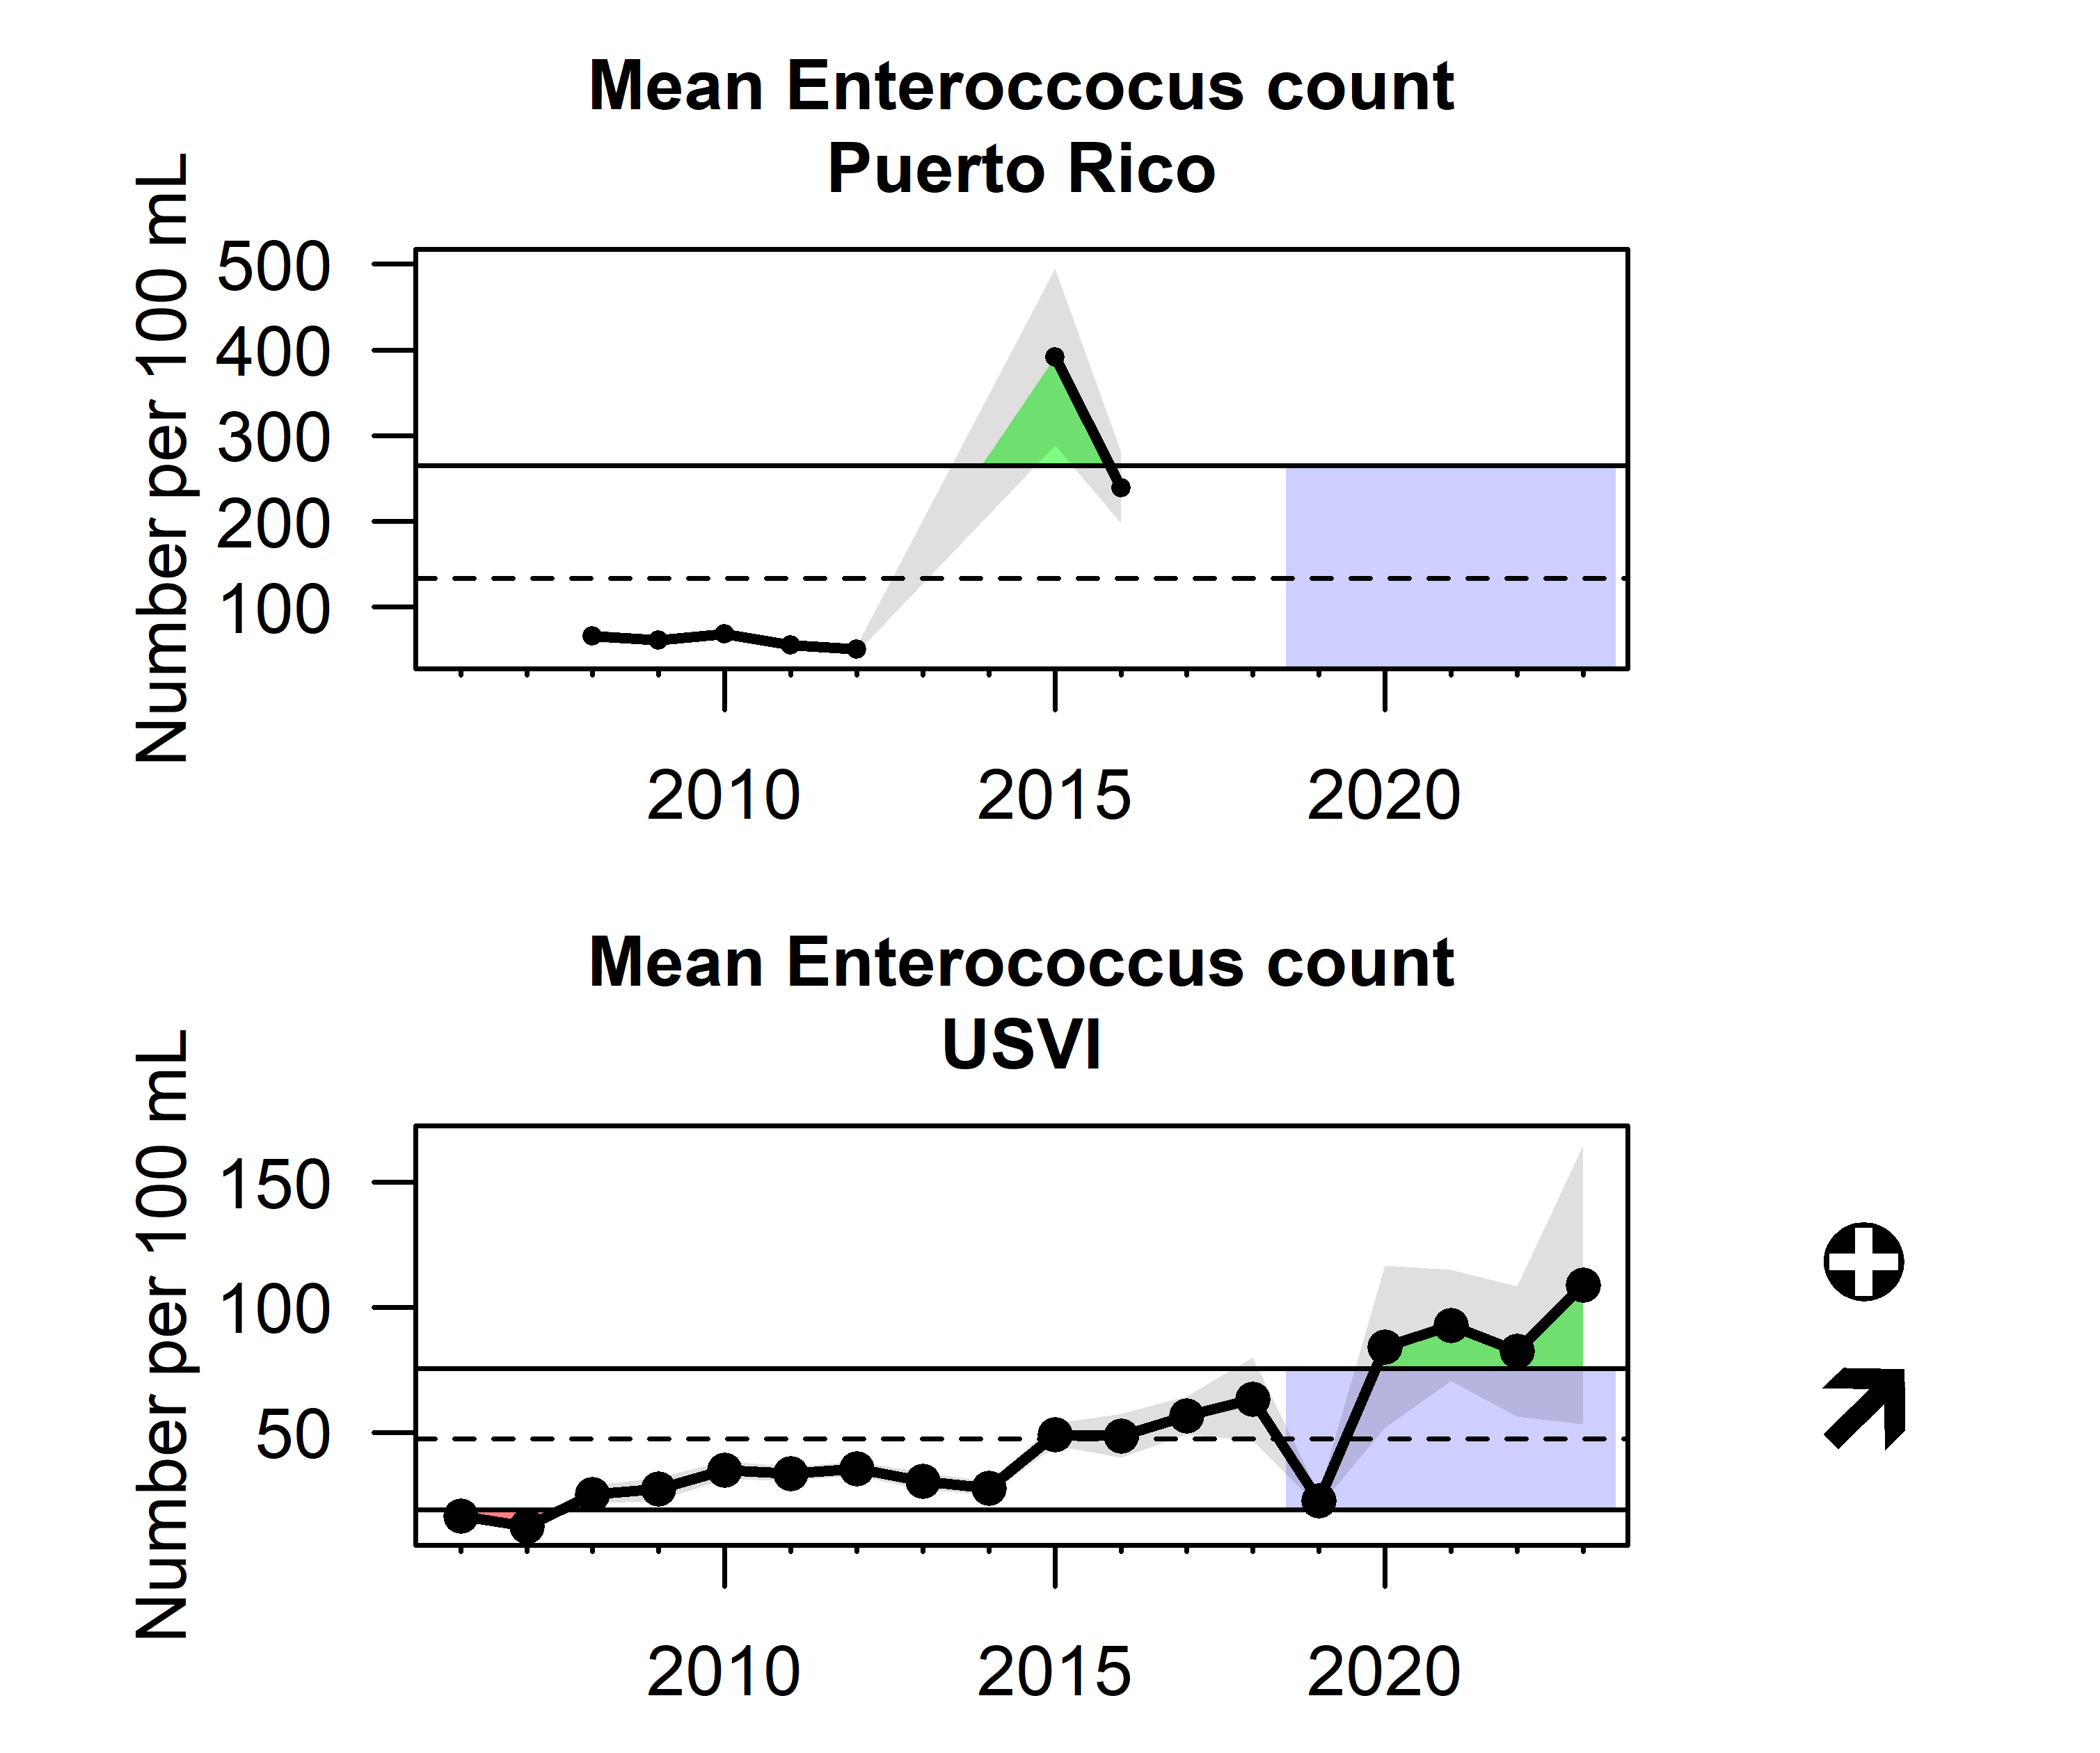
The presence of enterococci bacteria in water samples is used as a primary indicator of fecal contamination, which poses both environmental and human health risks (United States Environmental Protection Agency 2024). Water quality, biological, and physical data collected by the USGS, the EPA, and over 400 state, federal, tribal, and local agencies are publicly available via the EPA Water Quality Portal (https://www.waterqualitydata.us/). Data on enterococci abundance in beach samples throughout Puerto Rico and the USVI were downloaded and daily counts were averaged annually. Throughout the U.S. Caribbean region, there has been a substantial increase in the enterococcus count over time, with particularly high measured levels since 2020 in USVI; data in Puerto Rico are limited but also suggest an increasing trend (Figure 3.8).
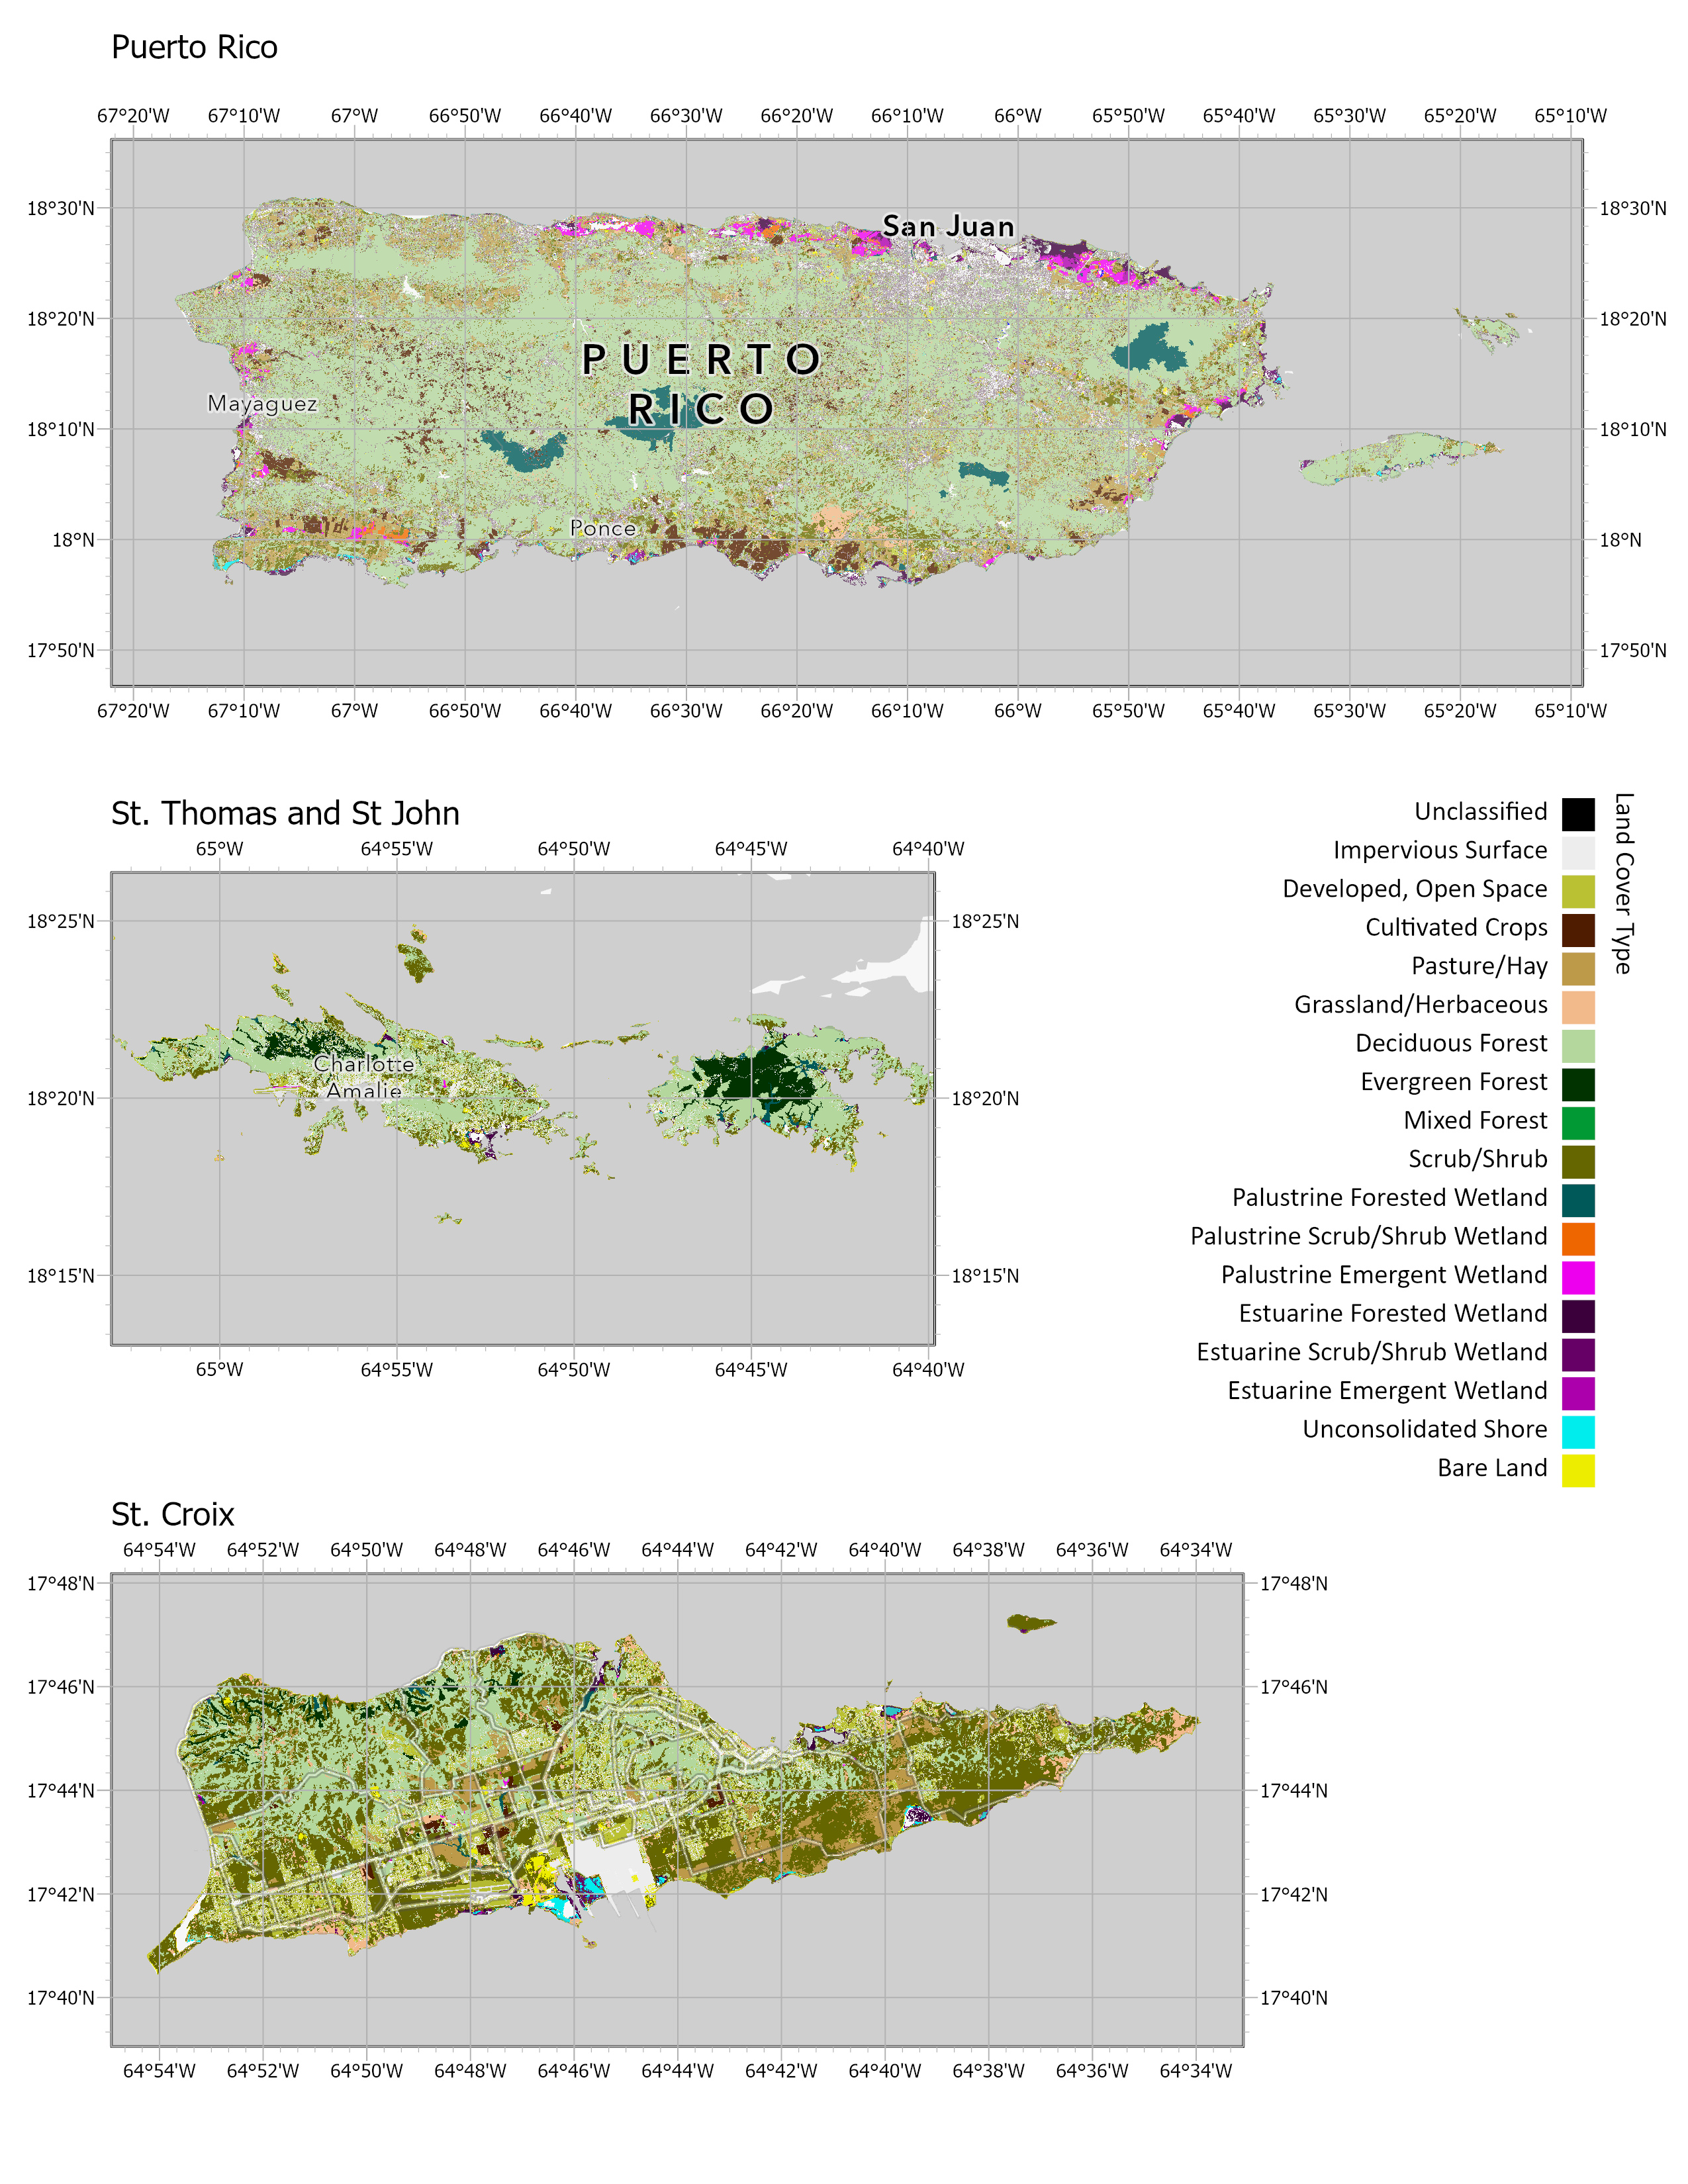
Coastal development
Impervious surfaces such as pavement, sidewalks, roofs and roads, as well as other forms of development, reduce the infiltration of water into the ground. Impervious surfaces often contribute to higher storm water runoff, greater sediment yields into coastal areas, and increased pollutant loads, all of which can degrade water quality (NOAA Digital Coast). This indicator influences water quality and turbidity in nearshore coastal habitat areas. As of 2022, the highest amount of impervious surfaces is seen in the San Juan metropolitan area (Figure 3.9).
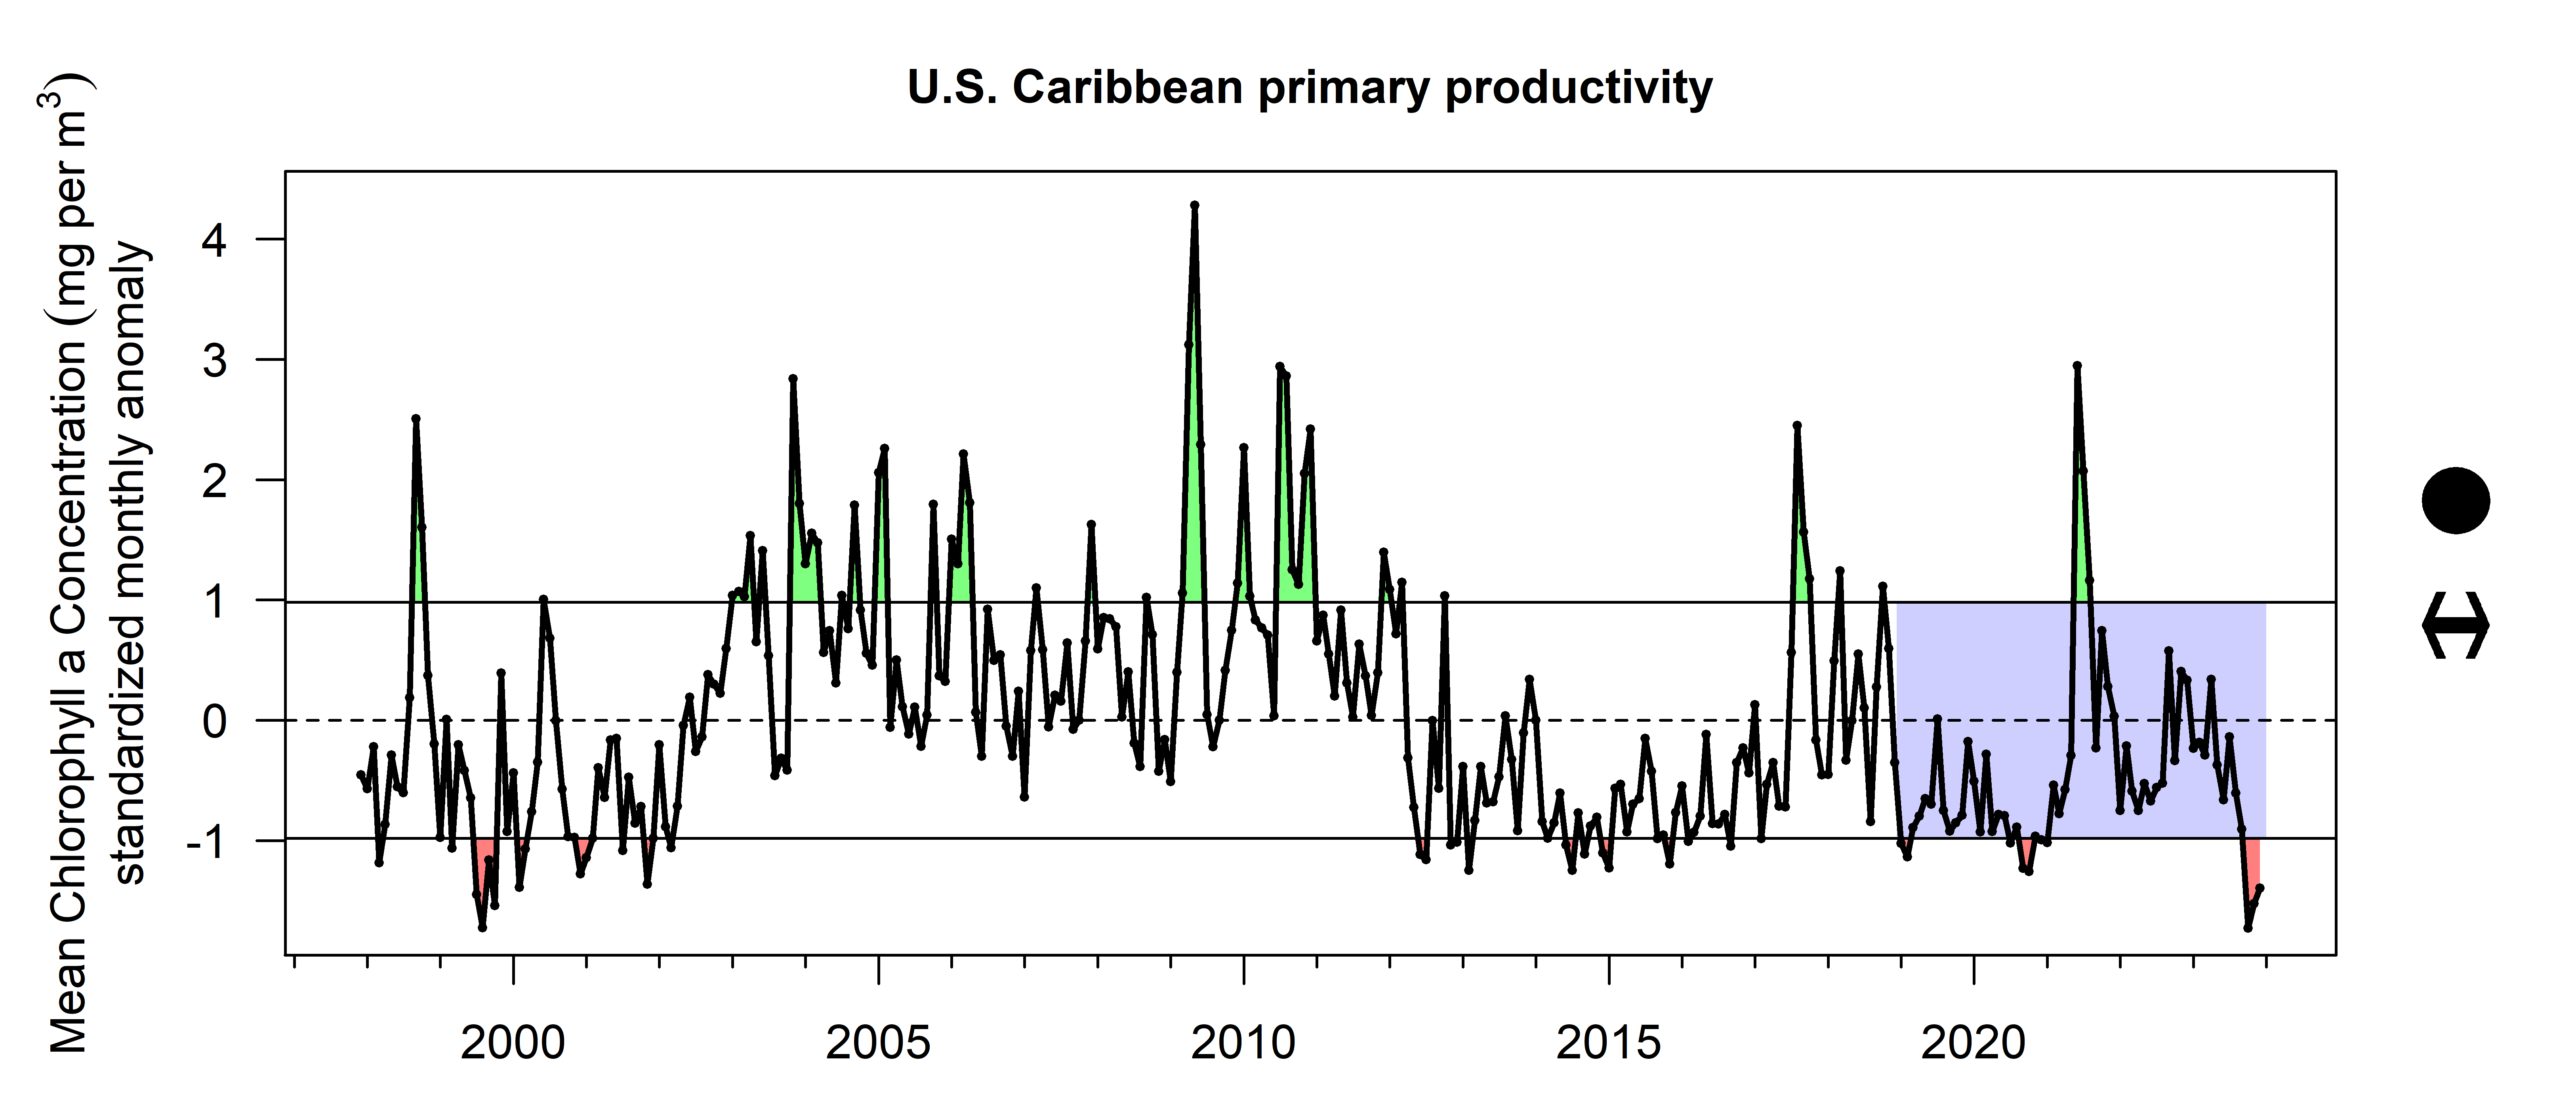
Primary productivity
Primary productivity is a measure of the total energy available in an ecosystem, and is closely correlated with chlorophyll a concentrations. Average chlorophyll a concentrations are derived from the European Space Agency Climate Change Initiative’s Ocean Colour product, which provides a bias-corrected composite of measurements merged from multiple satellite sensors (Hu, Lee, and Franz 2012). Concentrations are plotted as standardized monthly anomalies as there is a seasonal signal that could mask long-term trends. Estimates show a decadal cyclical pattern, with no overall or recent trend apparent (Figure 3.10).
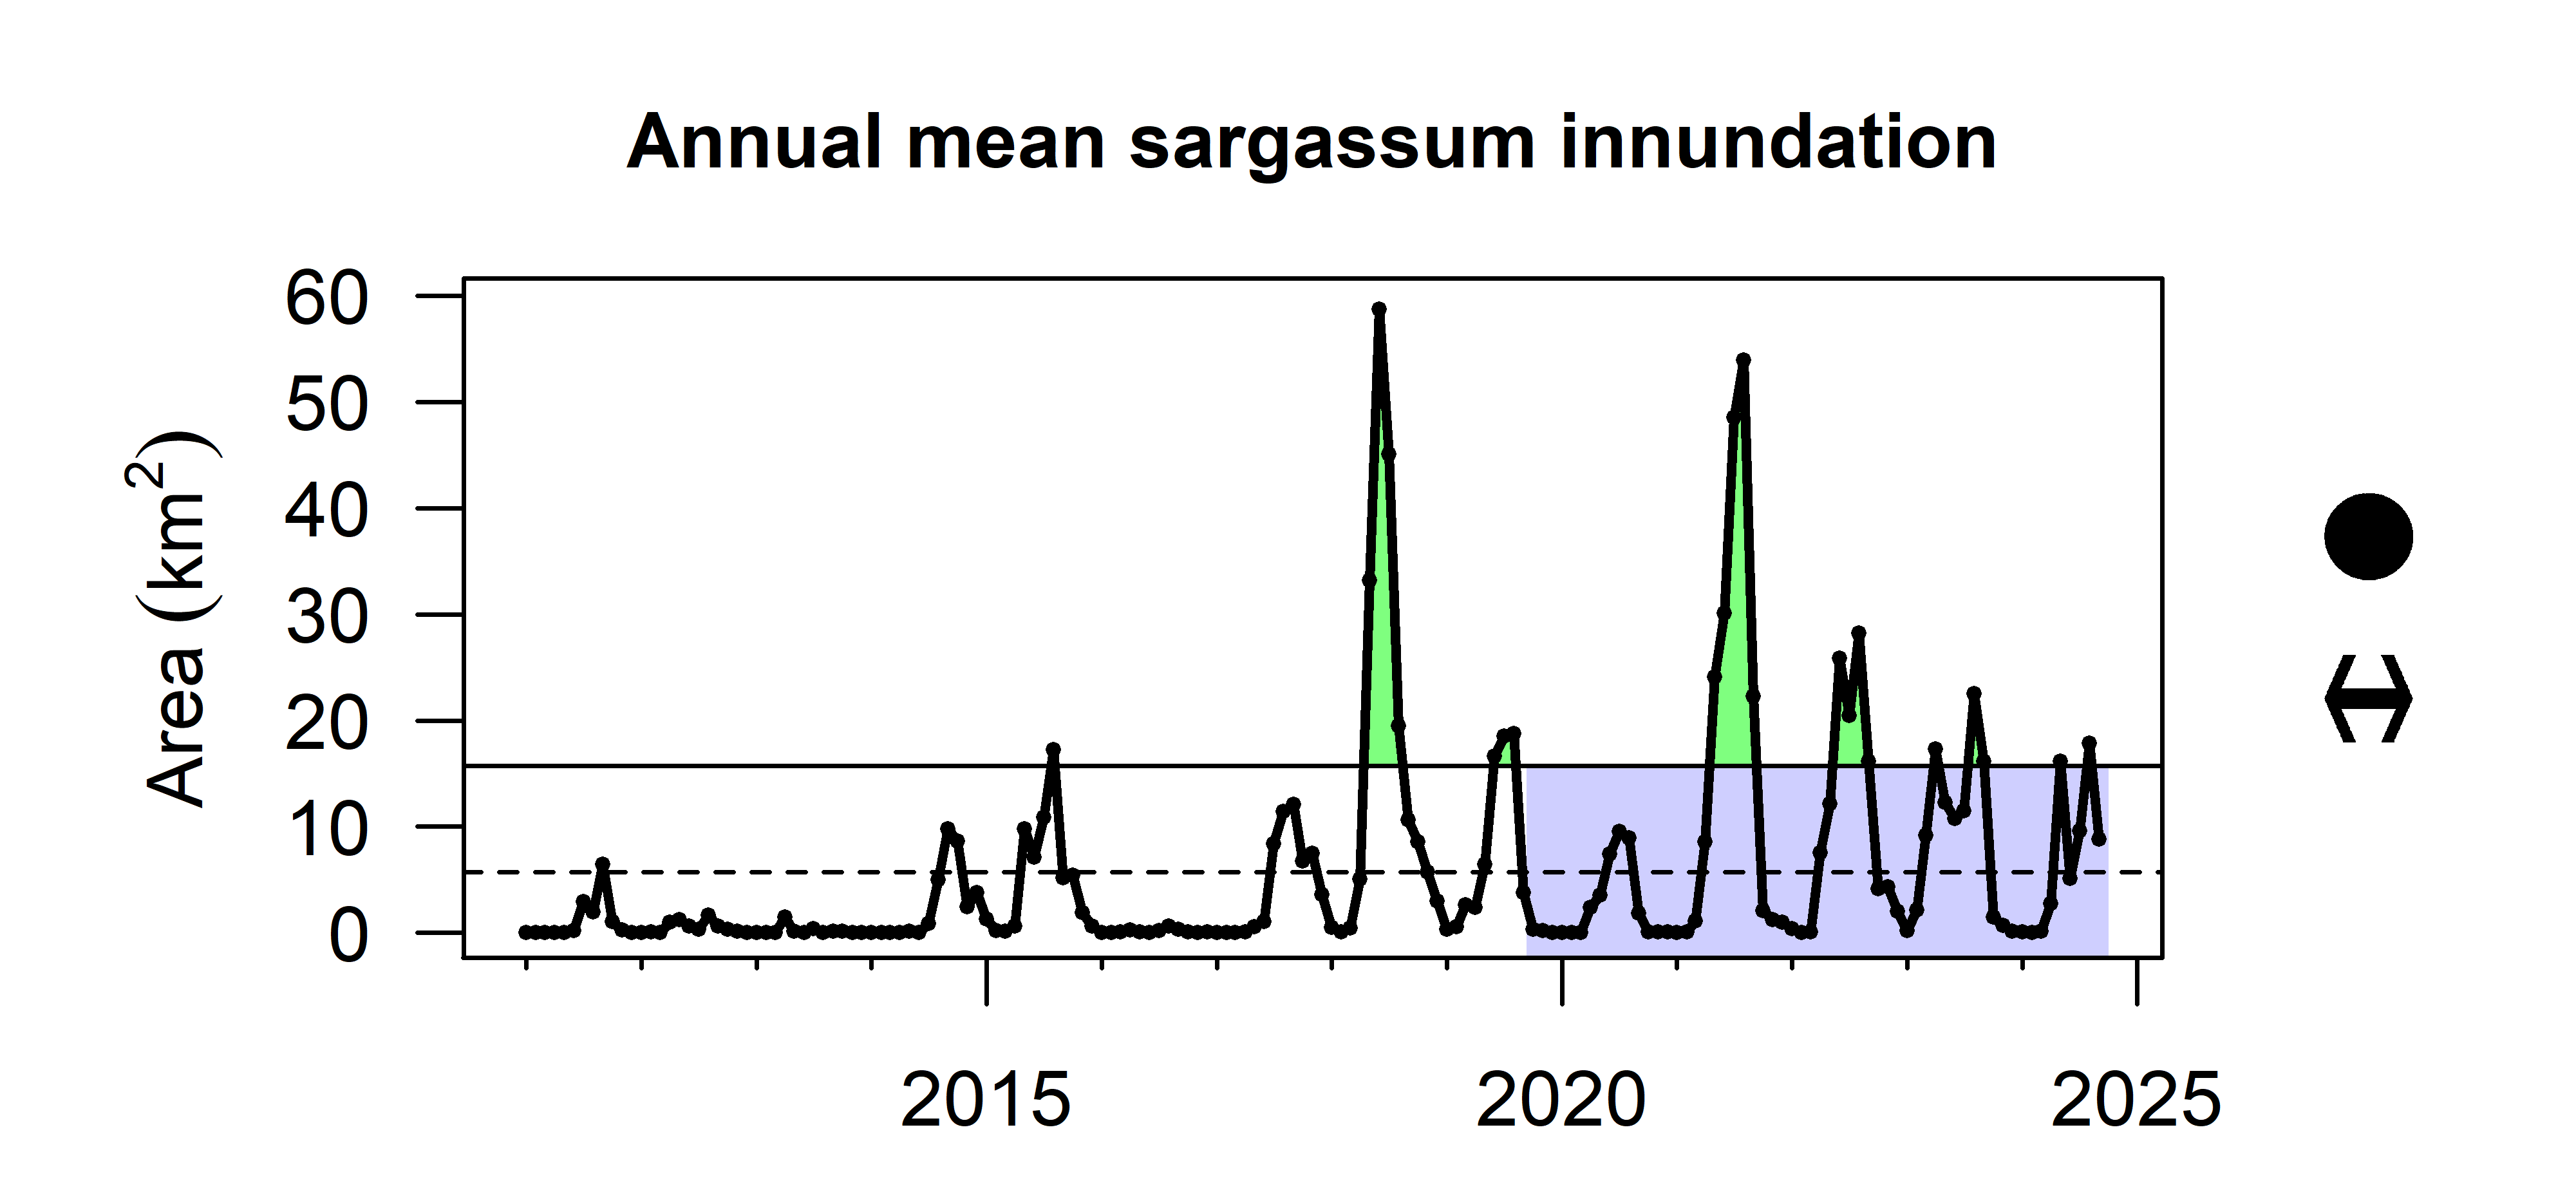
Sargassum inundation
Sargassum (brown macroalgae S. fluitains and S. natans) is a designated essential fish habitat important for many pelagic fish and protected species; however, when large blooms collect in nearshore environments they can reduce oxygen, suffocate beaches and have detrimental impacts on marine species (Hu et al. 2016). Mean monthly Sargassum wet biomass is estimated from satellite measurements using the algorithm of Wang et al. (2019). Sargassum blooms were largely absent from the U.S. Caribbean prior to 2011, but bloom activity has been generally increasing since that year (Figure 3.11). Major inundation events occurred in 2018 and 2021.
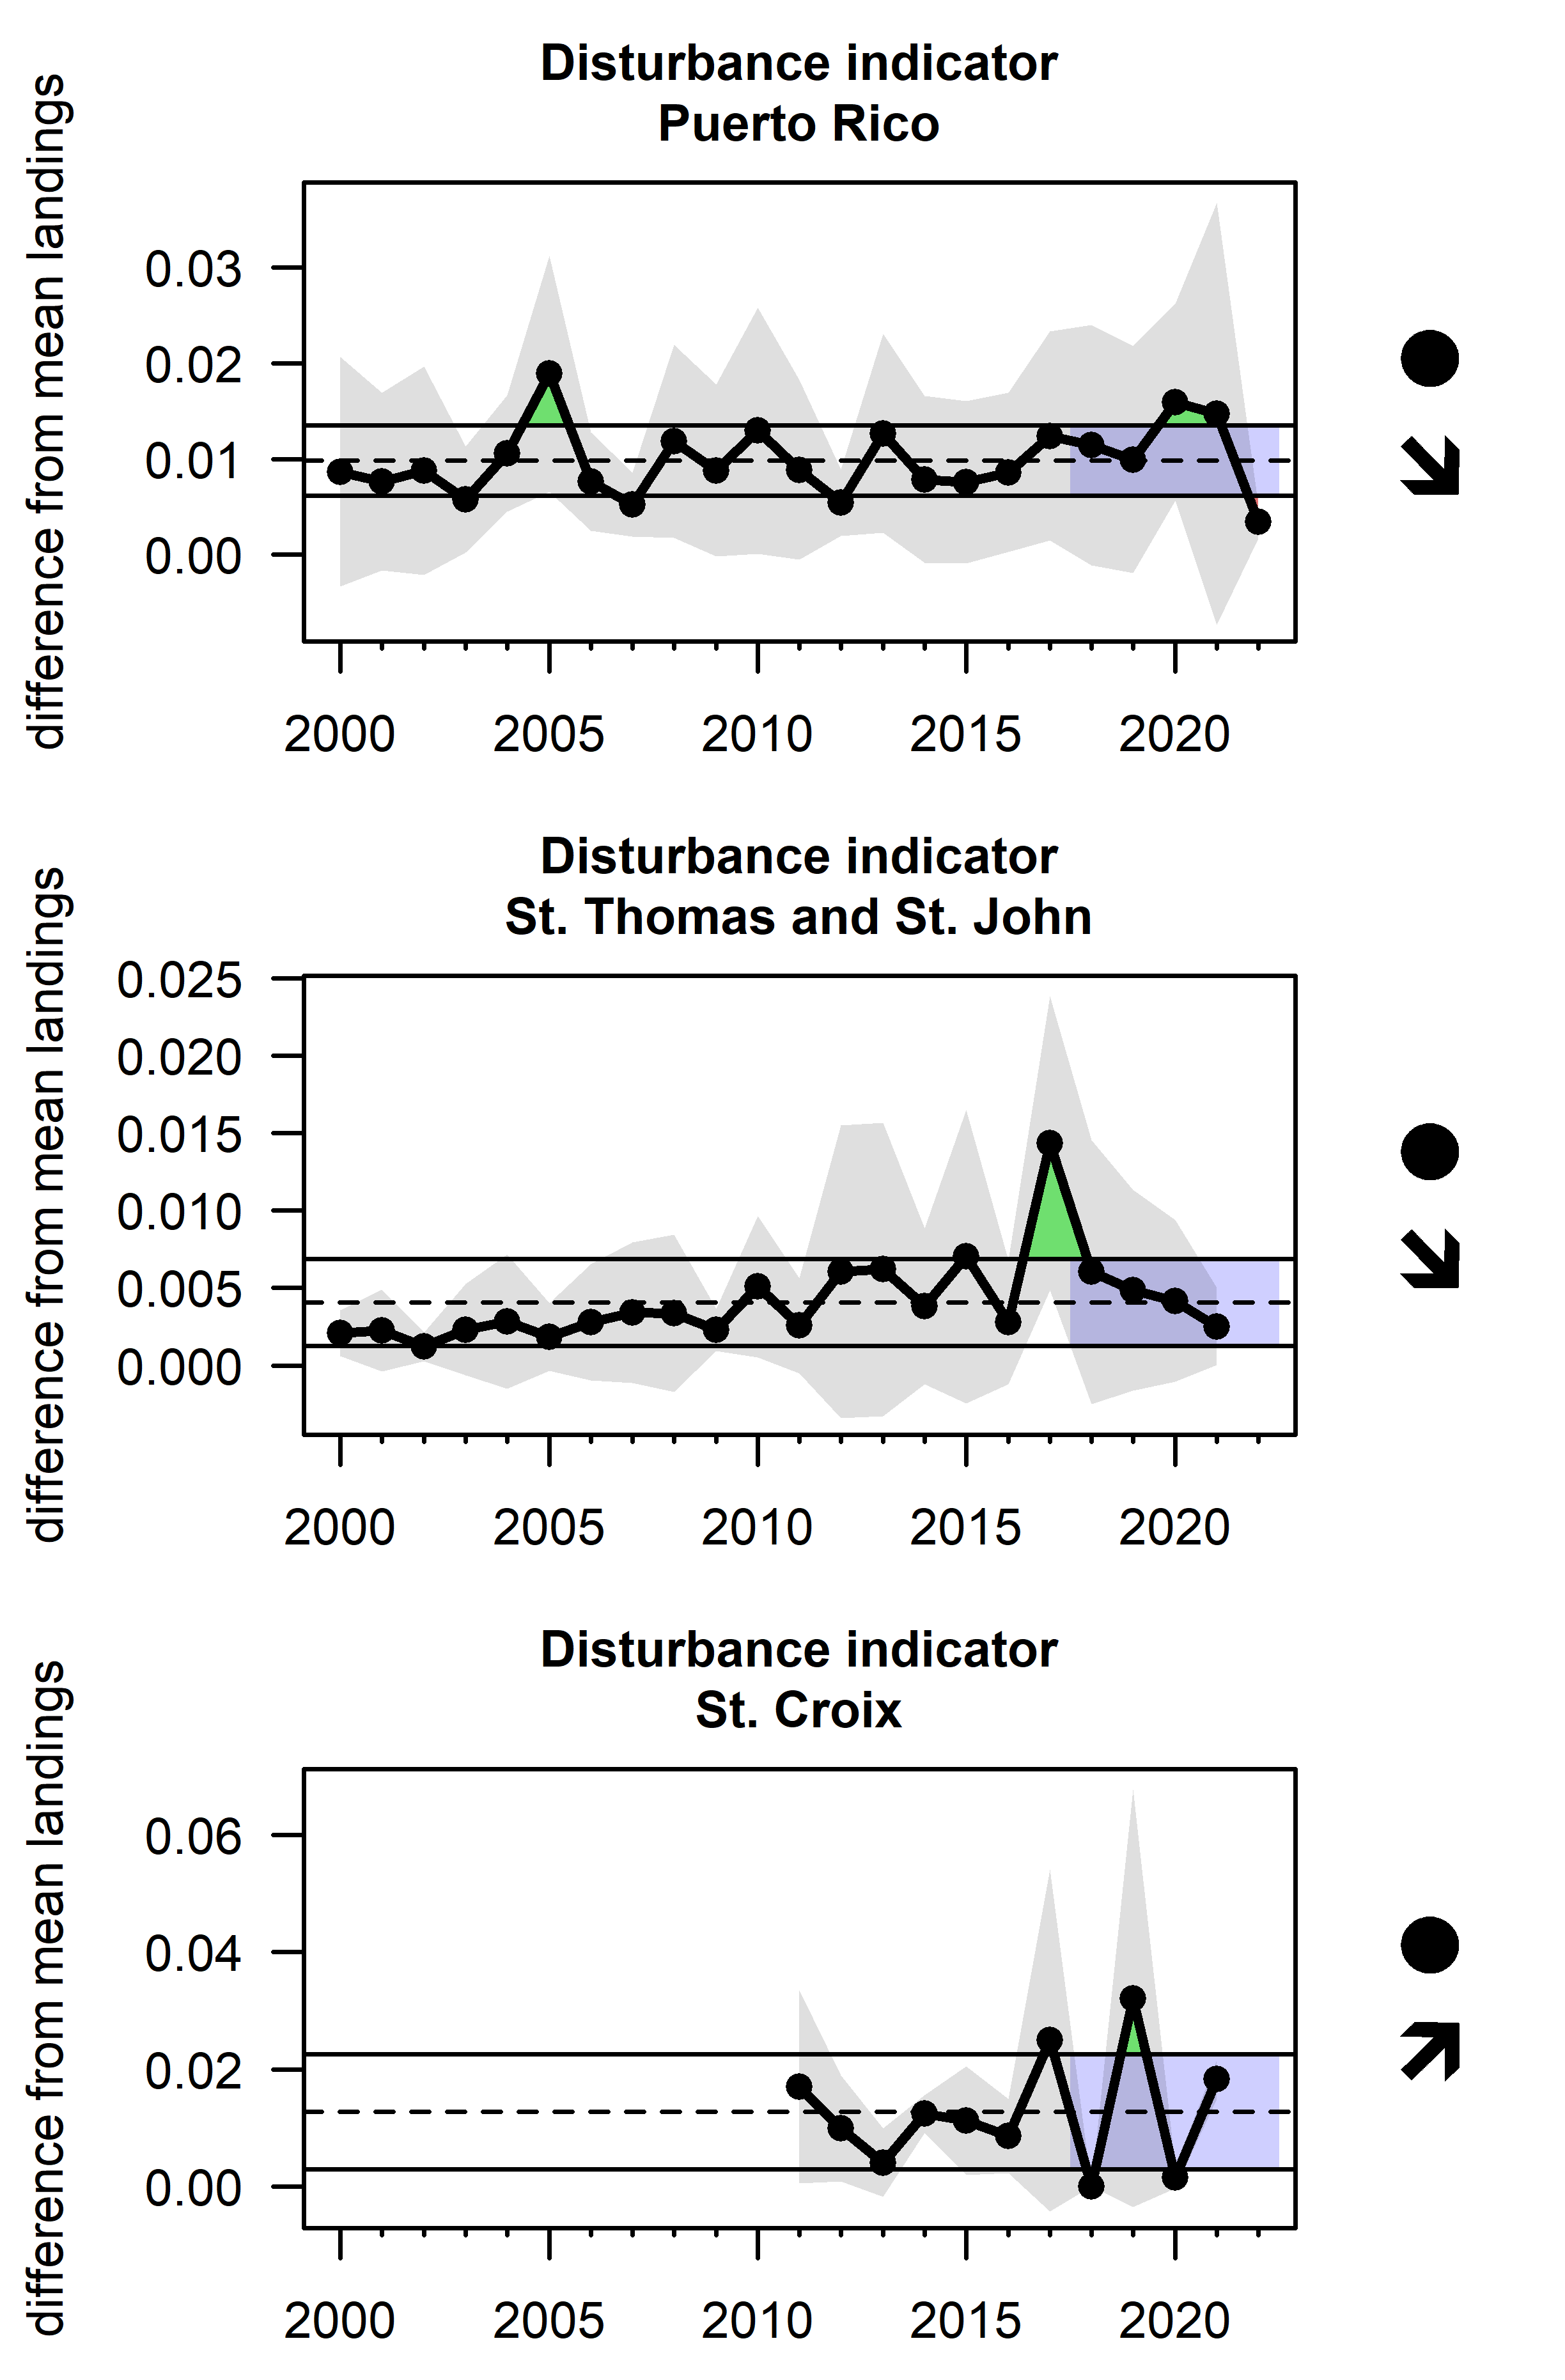
Market disturbances
Alterations to typical fishing patterns can be quantified by analyzing the seasonality of how fishing activity is distributed throughout the year and detecting deviations from average patterns. A market disturbance indicator was developed by calculating the proportion of landings in each month of the year, and summing the square of deviations between those monthly proportions from the mean proportions across all years:
\(D_y = \sum_{m=1}^{12} (P_{m,y} - \overline{P}_m)^2\)
This calculation was carried out for the species with highest landings that have not been subject to seasonal closures; the mean and standard deviation are calculated for the disturbance indicator across those species. In Puerto Rico, there is little trend in the disturbance indicator; however there were higher disturbance indicator values in 2005 and 2017. In St. Thomas, the indicator increases throughout time and detects a major disturbance in the 2017–2018 fishing season (i.e., July 1st 2017 to June 30th 2018). In St. Croix, disturbance levels were high in 2017–2018 and also 2019–2020 (Figure 3.12).
Human activity
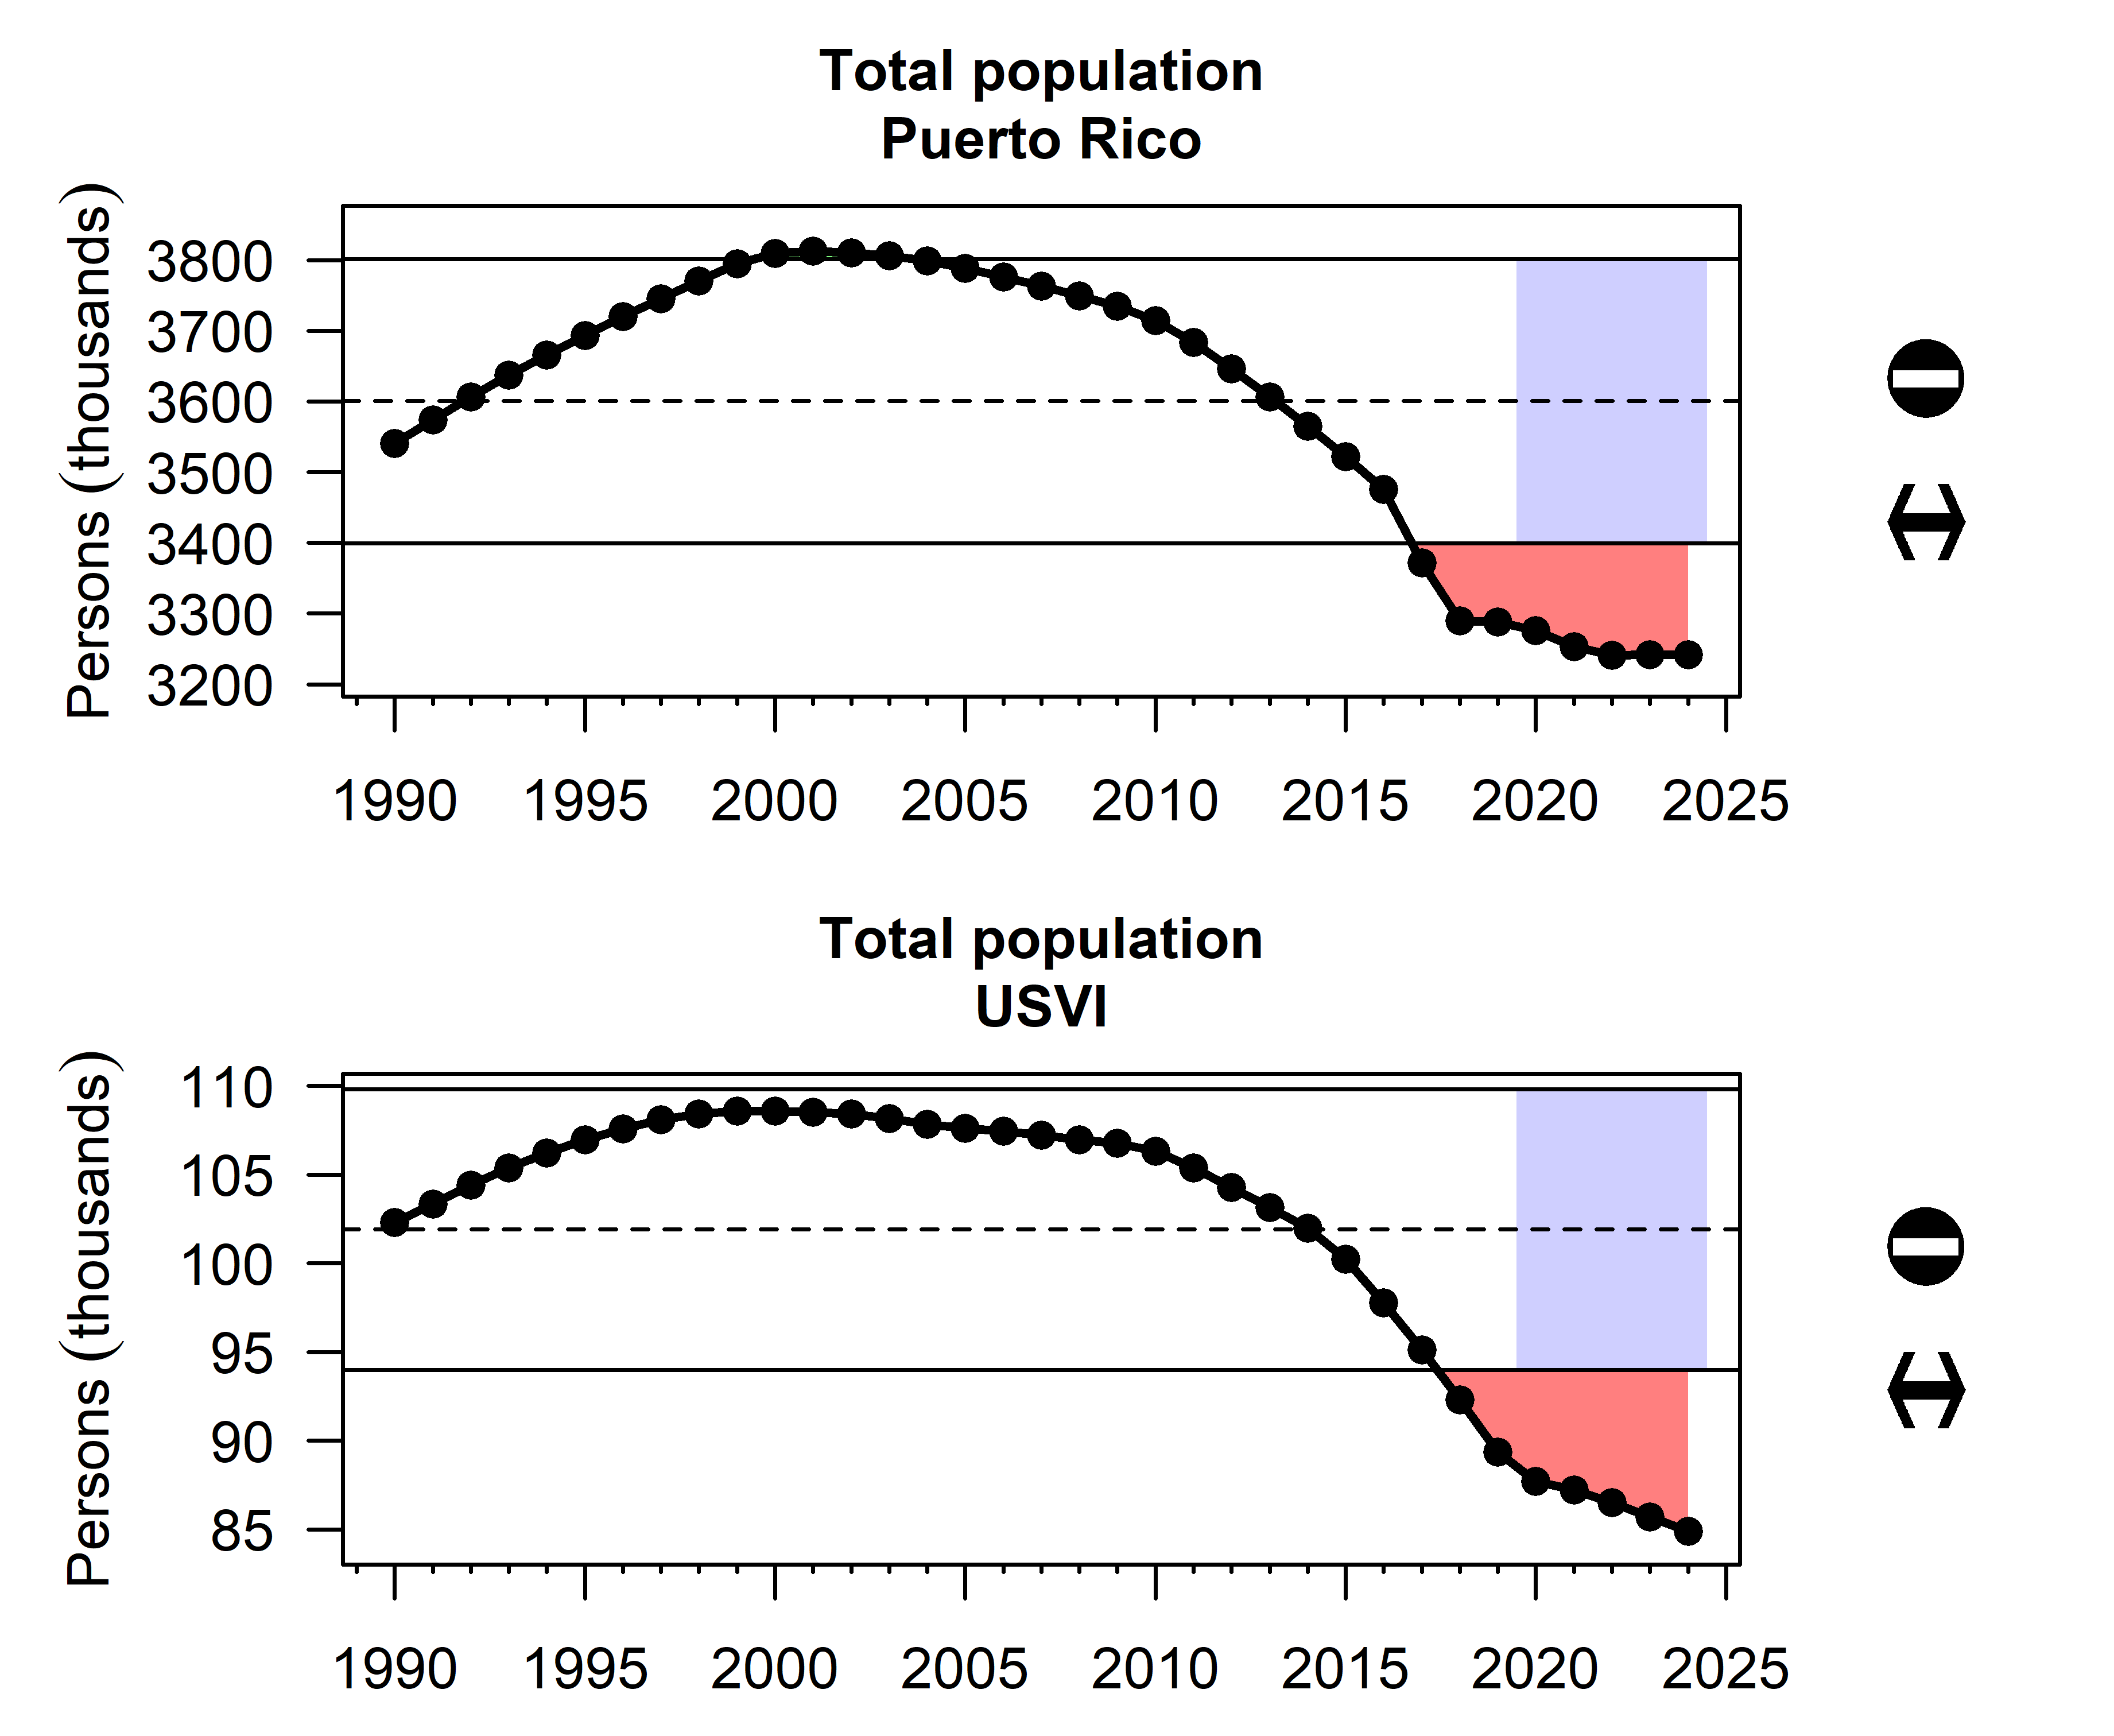
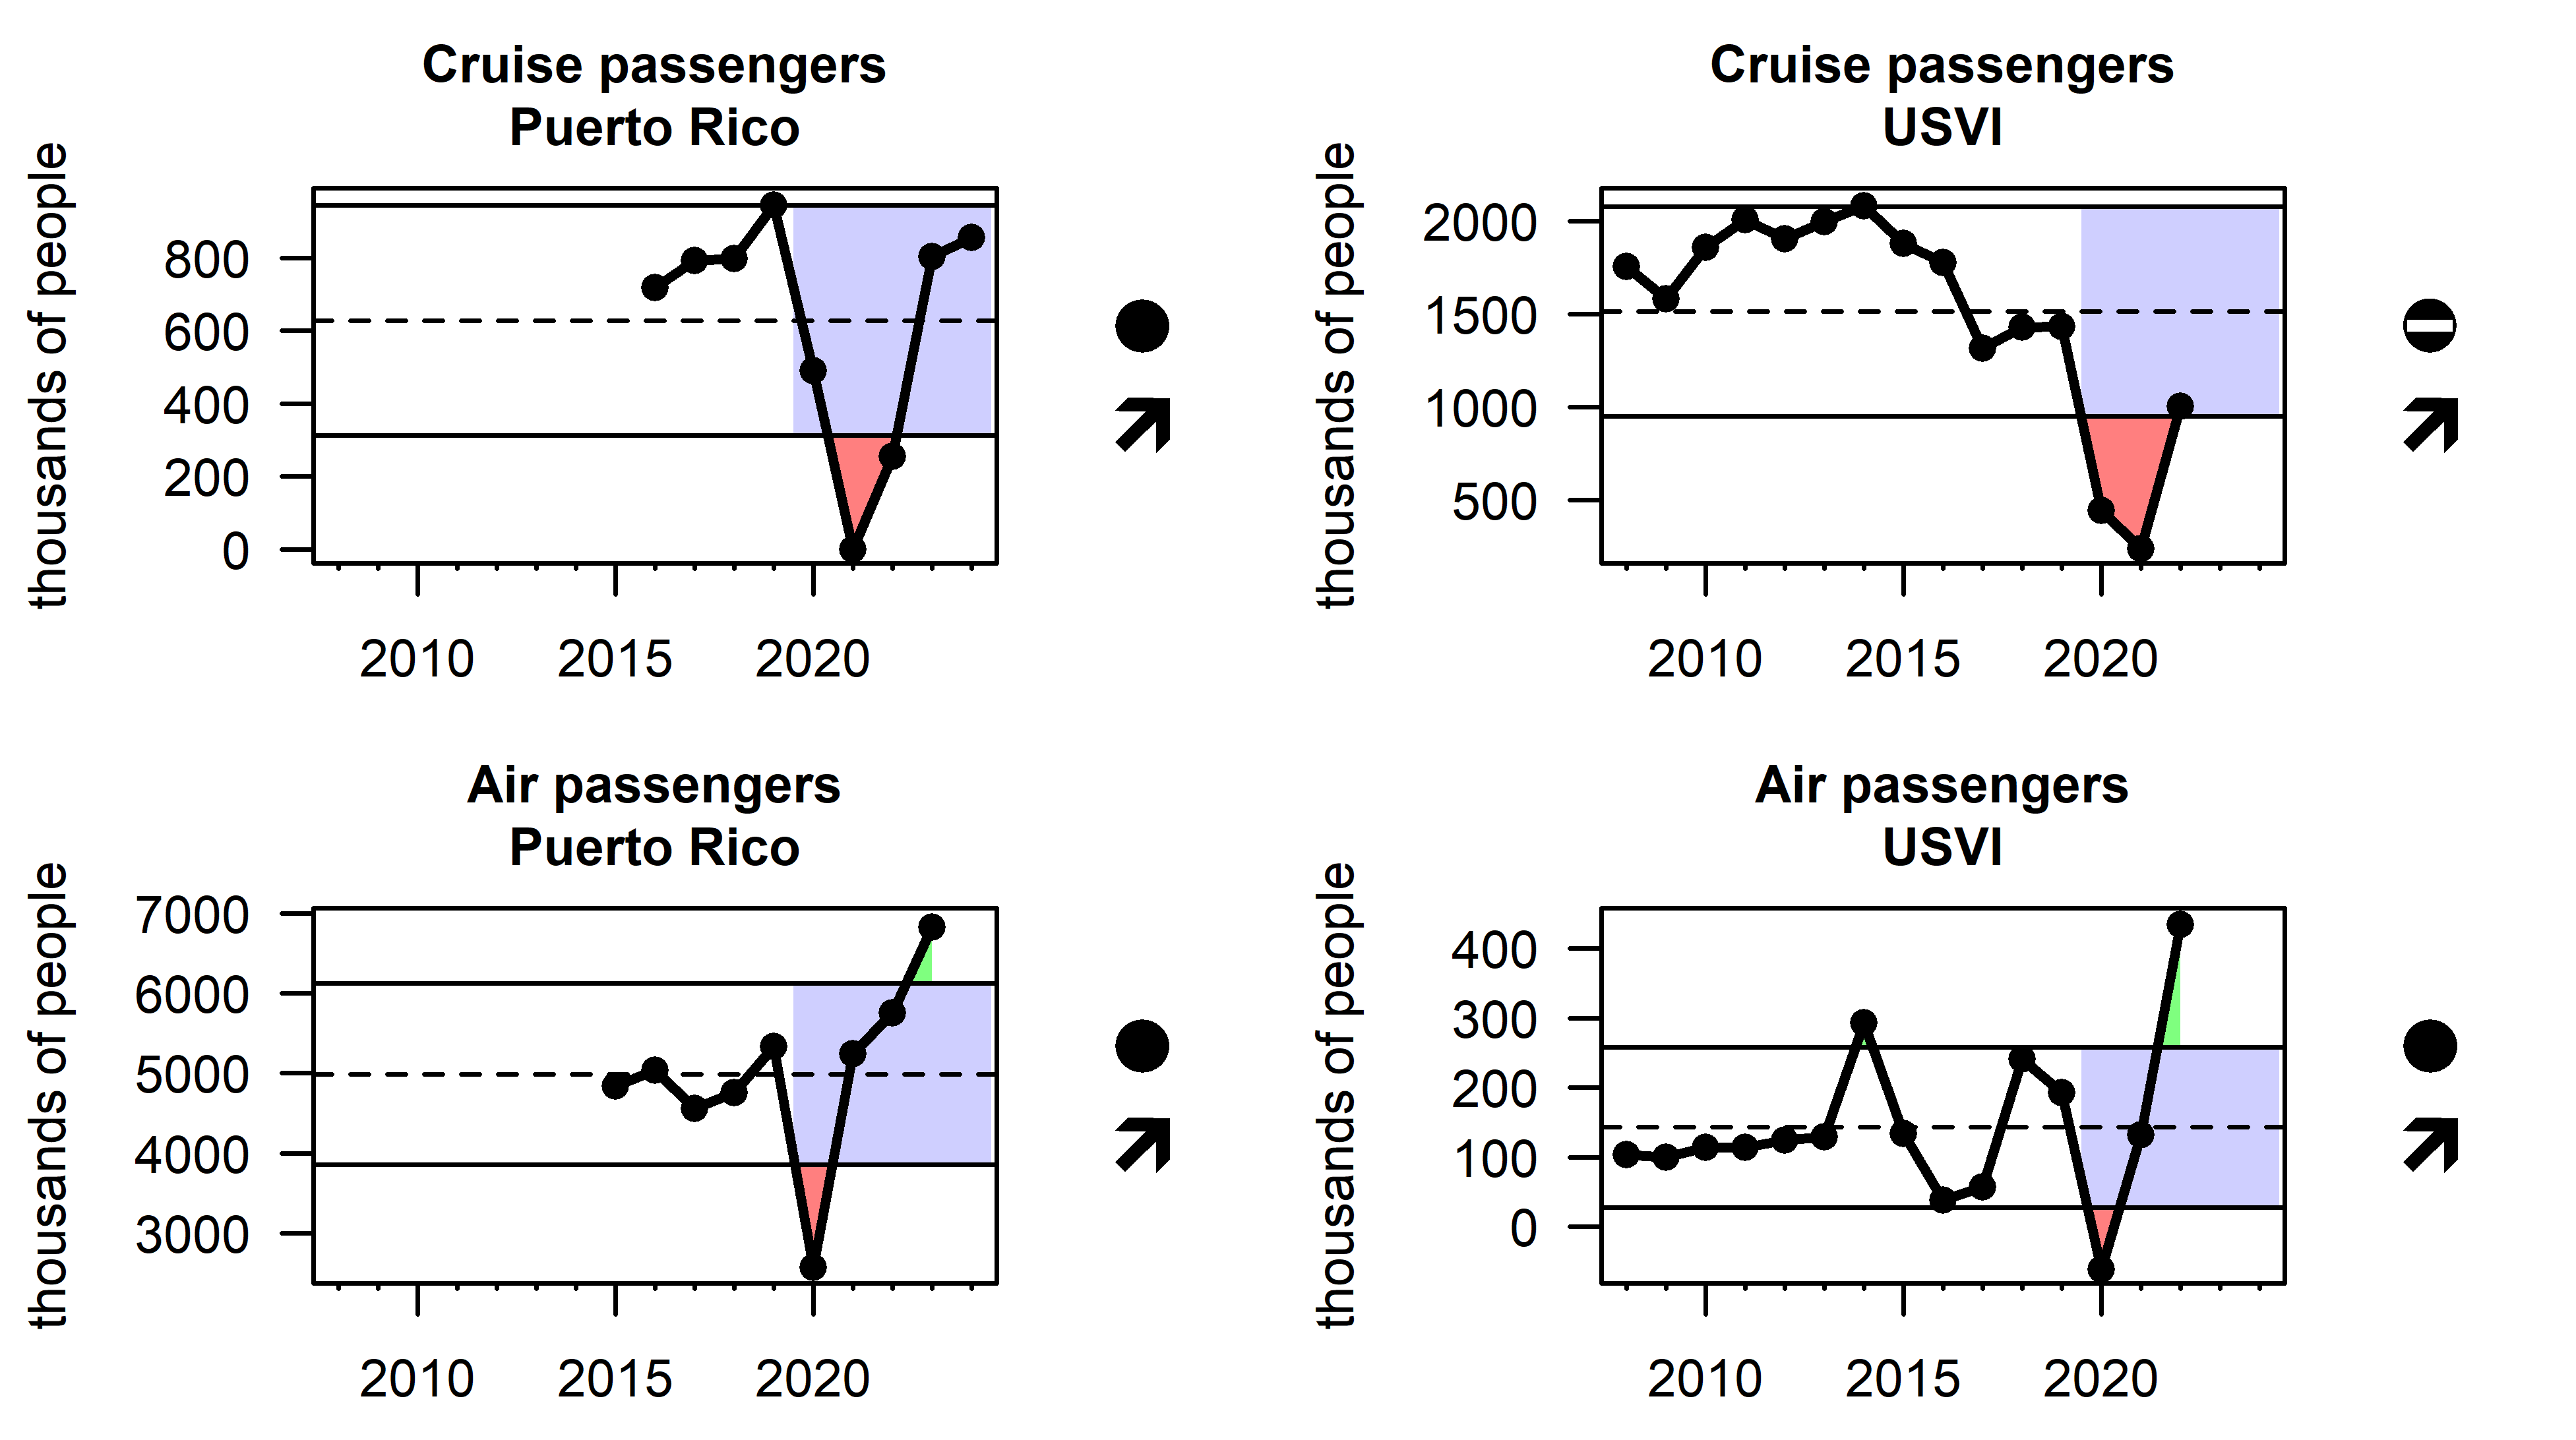
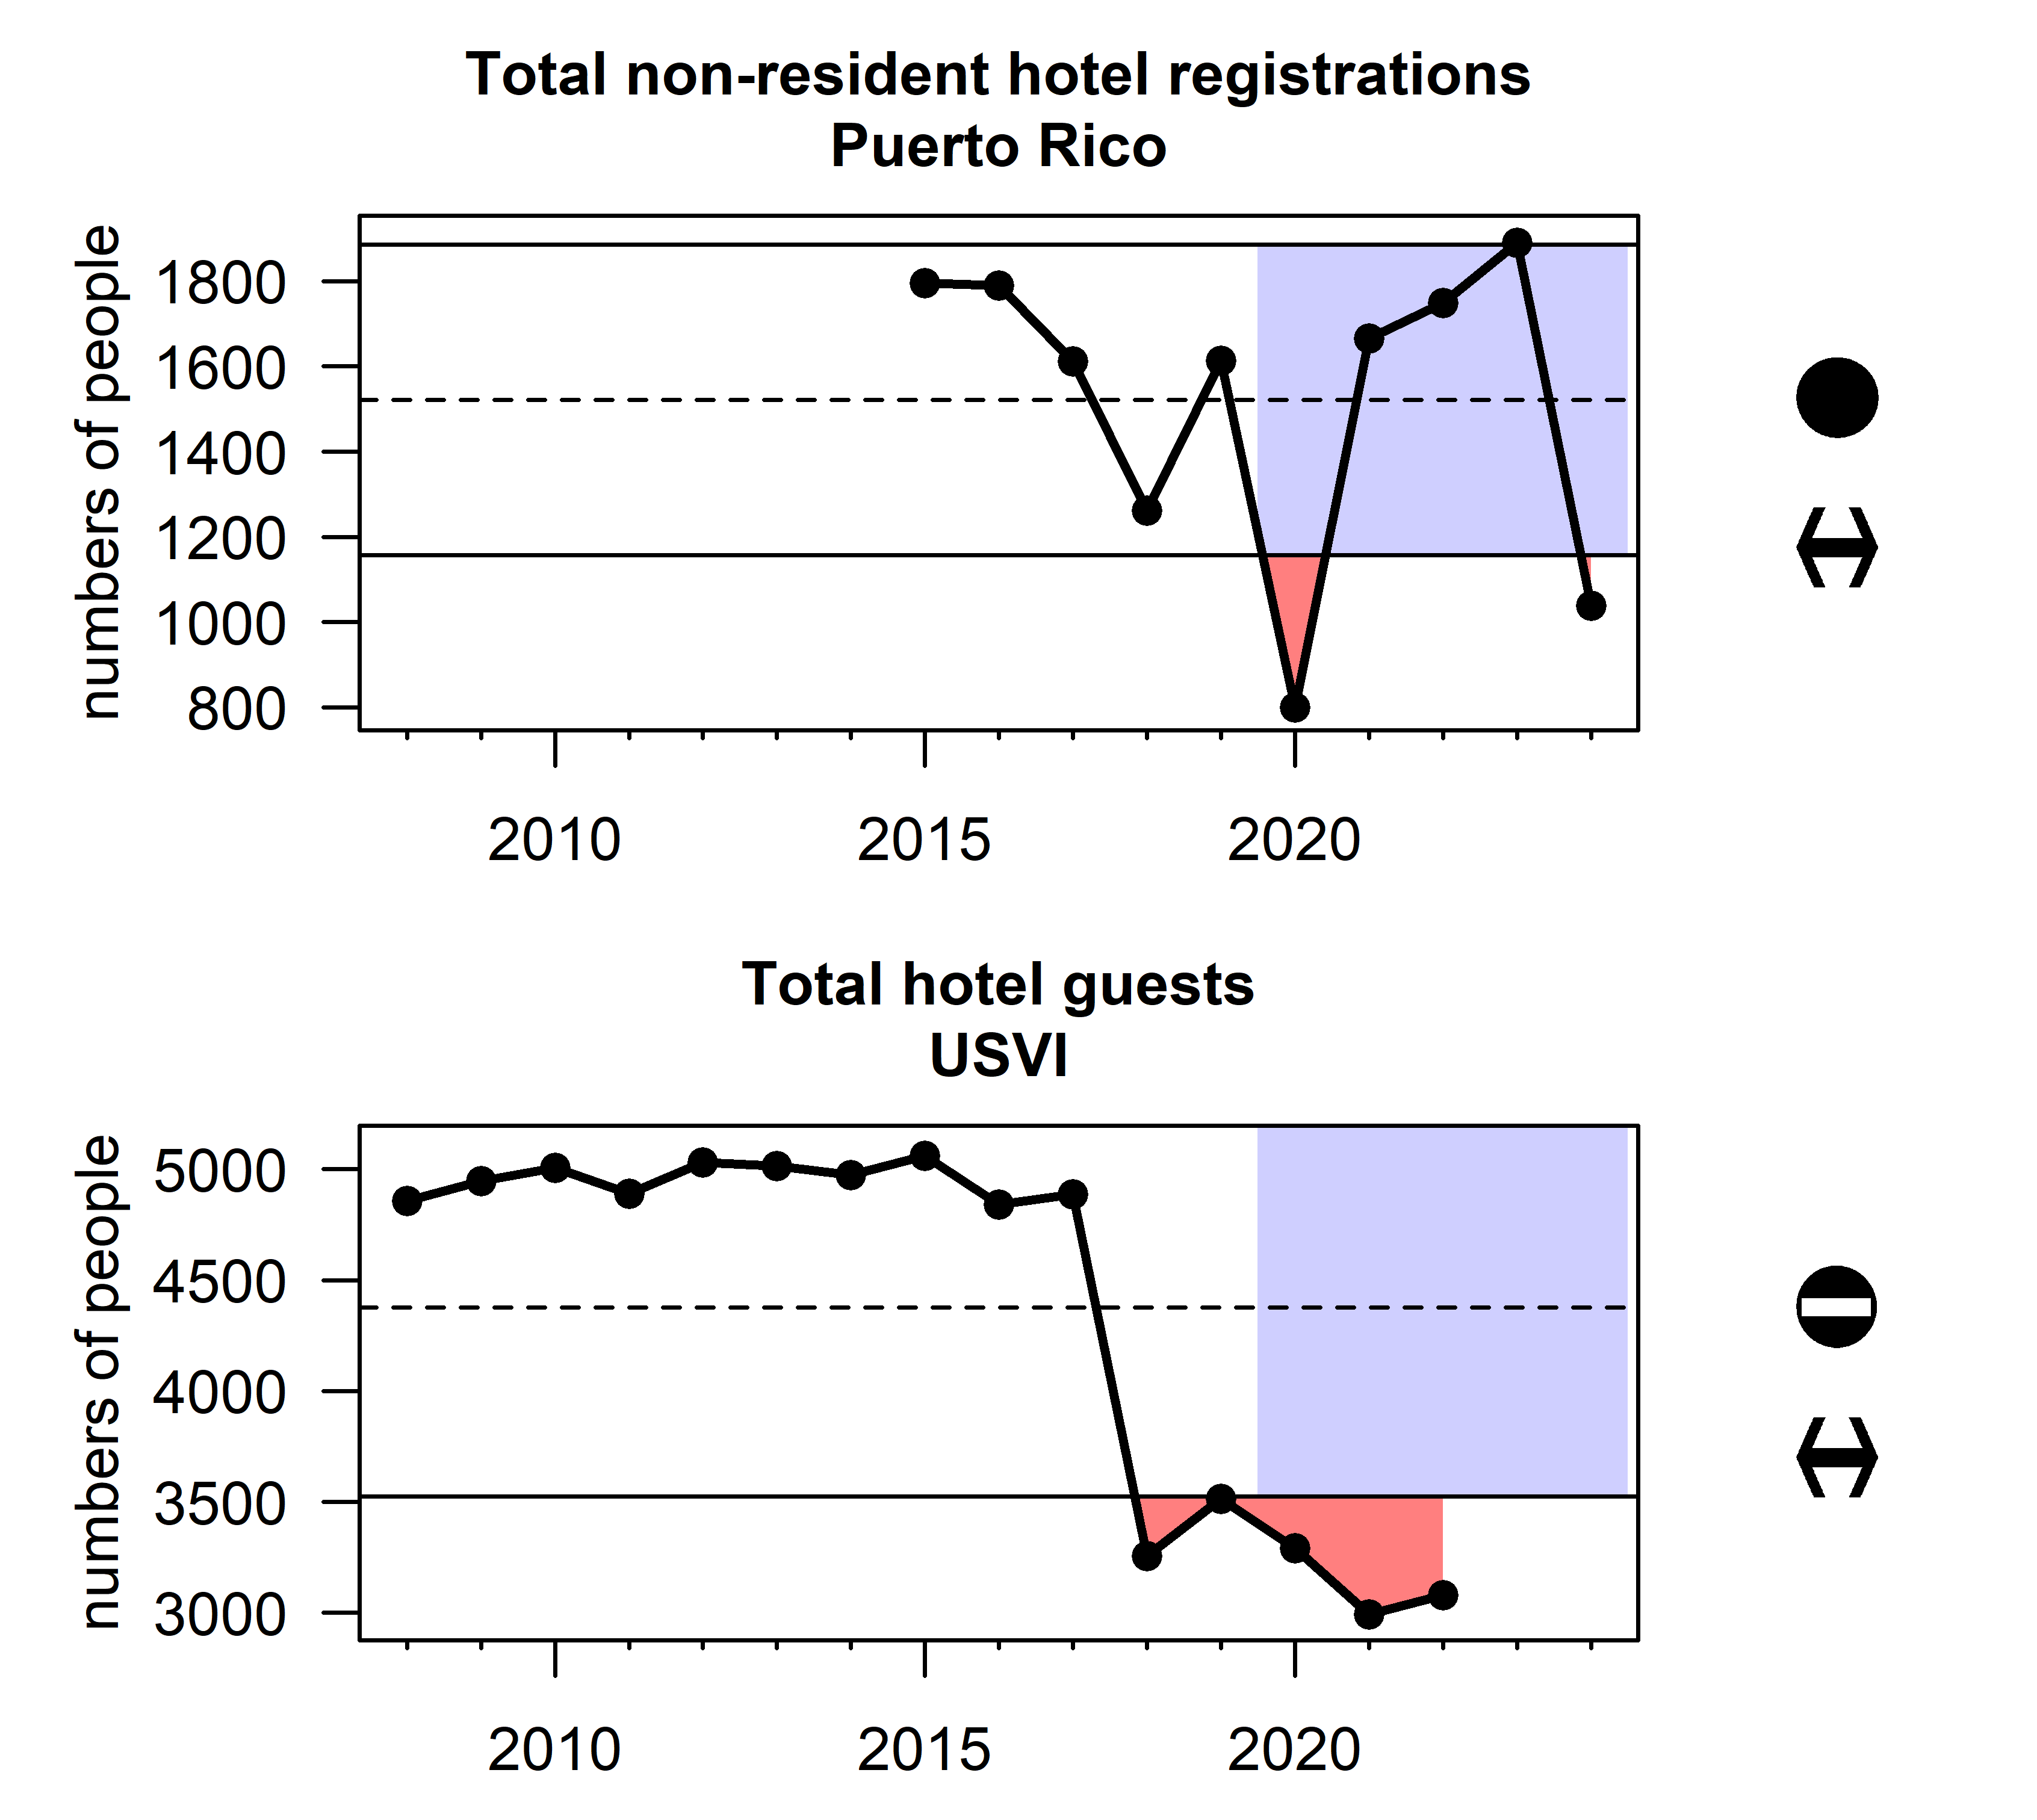
Human activity has an impact on the marine ecosystem indirectly through its influence on coastal development and pollution, as well as directly through marine tourism, fishing and demand for seafood. Human activity is exerted by the local population as well as the extensive tourism industry that exists in the U.S. Caribbean. Total population estimates are reported by the U.S. Census Bureau and tourism activity can be measured through hotel occupancy rates (data from the Puerto Rico Tourism Company and USVI Bureau of Economic Research) and the number of air and cruise passengers (data from the Puerto Rico Ports Authority and USVI Bureau of Economic Research). Human population in the U.S. Caribbean has been declining gradually since 2000 (Figure 3.13). Tourism has fluctuated over time, with major decreases in air and cruise passengers 2017 and 2020, but recovery to normal or above-normal levels since (Figure 3.14). A similar decline in hotel registrations in 2020 is apparent in the Puerto Rico data, following a general recovery. The total hotel guest count in USVI however declined in 2018 and has not recovered, though this is likely driven in part by a rise in vacation property rentals (Figure 3.15).
Agar, J., B. Stoffle, M. Shivlani, D. Matos-Caraballo, A. Mastitski, and F. Martin. 2022.
“One-Year COVID-19 Pandemic Impacts on U.S. Caribbean Small-Scale Fisheries with a Note on the Puerto Rican Earthquake Swarm of 2020 and 2021.” NOAA Technical Memorandum NMFS-SEFSC-759.
https://repository.library.noaa.gov/view/noaa/47711.
Andersson, A. J., I. B. Kuffner, F. T. Mackenzie, P. L. Jokiel, K. S. Rodgers, and A. Tan. 2009.
“Net Loss of CaCO\(_{3}\) from a Subtropical Calcifying Community Due to Seawater Acidification: Mesocosm-Scale Experimental Evidence.” Biogeosciences 6 (8): 1811–23.
https://doi.org/10.5194/bg-6-1811-2009.
Gomez, Fabian A., and Sang-Ki Lee. 2023.
“Surface North Atlantic MOM5-TOPAZ Outputs Derived from a Regular Hindcast and a Robust Diagnostic Simulation Experiment from 1980-01-01 to 2017-12-31 (NCEI Accession 0283628).” NOAA National Centers for Environmental Information. Dataset. Accessed: 2023-02-19.
https://www.ncei.noaa.gov/archive/accession/0283628.
Hu, Chuanmin, Zhongping Lee, and Bryan Franz. 2012.
“Chlorophyll Algorithms for Oligotrophic Oceans: A Novel Approach Based on Three-Band Reflectance Difference.” Journal of Geophysical Research: Oceans 117: C01011.
https://doi.org/10.1029/2011JC007395.
Hu, Chuanmin, Brock Murch, Brian Barnes, Mengqiu Wang, Jean-Philippe Maréchal, James Franks, Brian Lapointe, Deb Goodwin, Jeffrey Schell, and Amy Siuda. 2016.
“Sargassum Watch Warns of Incoming Seaweed.” Eos 97 (September).
https://doi.org/10.1029/2016EO058355.
Knapp, Kenneth R., Michael C. Kruk, David H. Levinson, Howard J. Diamond, and Charles J. Neumann. 2010.
“The International Best Track Archive for Climate Stewardship (IBTrACS).” https://doi.org/10.1175/2009BAMS2755.1.
NOAA Coral Reef Watch. 2019.
“NOAA Coral Reef Watch 5km Regional Virtual Stations Degree Heating Weeks V3.1 Jan 1, 1985 - Dec 31, 2023.” Data Set Accessed 2024-10-31. Silver Spring, MD. USA.
https://coralreefwatch.noaa.gov/product/vs/data.php.
Reynolds, Richard W., Thomas M. Smith, Chunying Liu, Dudley B. Chelton, Kenneth S. Casey, and Michael G. Schlax. 2007.
“Daily High-Resolution-Blended Analyses for Sea Surface Temperature.” https://doi.org/10.1175/2007JCLI1824.1.
Seara, Tarsila, Stacey M. Williams, Kiara Acevedo, Graciela Garcia-Molliner, Orian Tzadik, Michelle Duval, and Juan J. Cruz-Motta. 2024.
“Development and Analyses of Stakeholder Driven Conceptual Models to Support the Implementation of Ecosystem-Based Fisheries Management in the U.S. Caribbean.” PLOS ONE 19 (5): e0304101.
https://doi.org/10.1371/journal.pone.0304101.
Sumy, Danielle F., Russ Welti, and Michael Hubenthal. 2020.
“Applications and Evaluation of the IRIS Earthquake Browser: A Web-Based Tool That Enables Multidimensional Earthquake Visualization.” Seismological Research Letters 91 (5): 2922–35.
https://doi.org/10.1785/0220190386.
United States Environmental Protection Agency. 2024.
“Indicators: Enterococci.” https://www.epa.gov/national-aquatic-resource-surveys/indicators-enterococci.
Wang, Menghua, SeungHyun Son, and Lawrence W. Harding Jr. 2009.
“Retrieval of Diffuse Attenuation Coefficient in the Chesapeake Bay and Turbid Ocean Regions for Satellite Ocean Color Applications.” Journal of Geophysical Research: Oceans 114: C10011.
https://doi.org/10.1029/2009JC005286.
Wang, Mengqiu, Chuanmin Hu, Brian B. Barnes, Gary Mitchum, Brian Lapointe, and Joseph P. Montoya. 2019.
“The Great Atlantic Sargassum Belt.” Science 365: 83–87.
https://www.science.org/doi/10.1126/science.aaw7912.