4 Integrated ecosystem perspectives
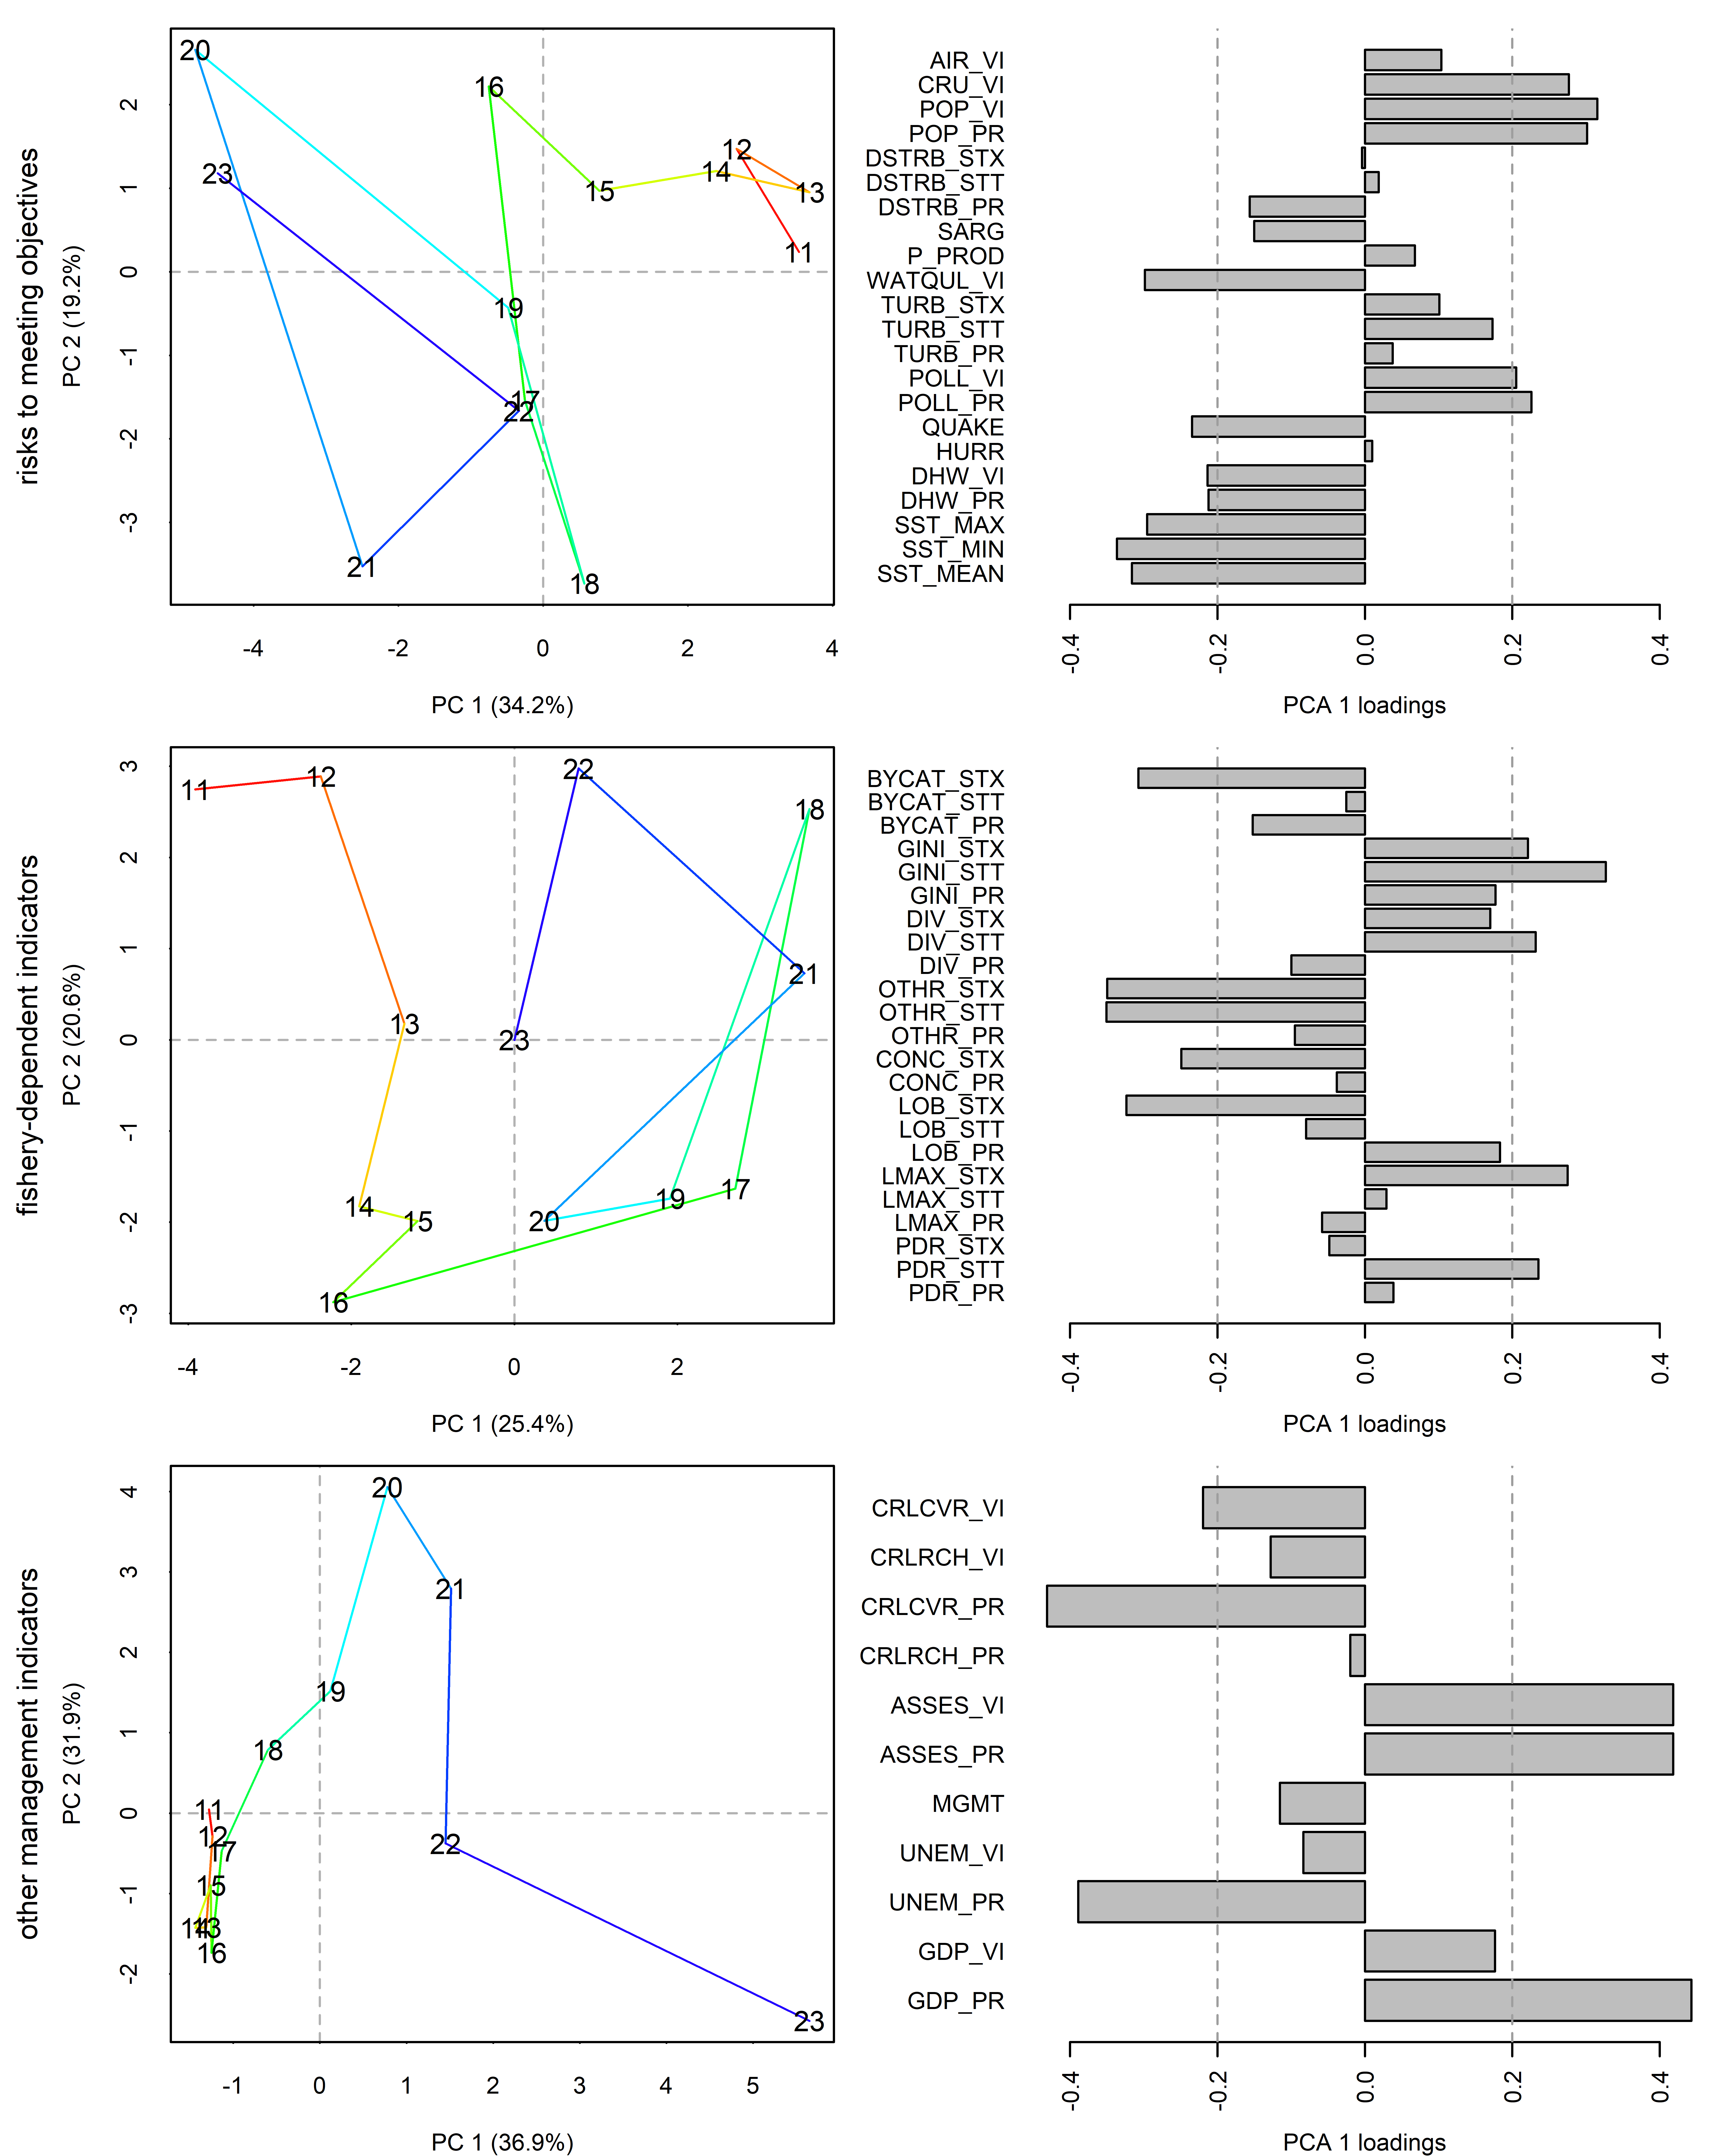
For the purpose of synthesizing the information contained in the full suite of indicators presented in this report, we analyze the full indicator suite using multivariate methods. Principal components analysis (PCA) is a statistical method that distills a large number of potentially related indicators into a smaller number of indices representing most of the variability in the data set. We analyze the indicator suite separately by category: 1) risks to meeting management objectives, 2) management objective indicators based on fishery-independent data, 3) management objective indicators based on fishery-dependent data, and 4) other management objective indicators. A traffic light plot of the indicator suite is presented for the purpose of comprehensively viewing changes in the different parts of the ecosystem over time (Figure 4.1). A biplot of the principal components analysis is presented to convey temporal patterns in the progression of ecosystem status (Figure 4.2). PCA was carried out on a scaled matrix for all indicators with at least 12 years of data; any missing values were imputed with means of the time series. In the biplot, the labels represent time (years 2011 – 2023), the rainbow line represents chronology between adjacent years, and the distance between points conveys how different the indicator values were in those years.
Many indicators are based on time series of limited extent or contain data gaps, which makes it challenging to elucidate overall trends. However, the traffic plot conveys that many indicator values undergo rapid change in the period 2017-2021, and the PCA biplots confirm these patterns as there are larger two-dimensional shifts between these years. These shifts are most likely driven by several major stressor events in this time period, including the major hurricanes Maria and Irma (2017) and the COVID pandemic (2020-2021). Together, the multivariate analyses suggest that these events have had some destabilizing impacts on the U.S. Caribbean fishery ecosystem.


